This is an old revision of the document!
Table of Contents
PPro8 TMS概览窗口
This work is licensed under a Creative Commons Attribution-NonCommercial-NoDerivs 3.0 Unported License.
PPro8概览窗口显示交易员当天的交易活动汇总信息。
开启一个Summary概览窗口
1. 在PPro8的工具栏,点击Summary按钮。

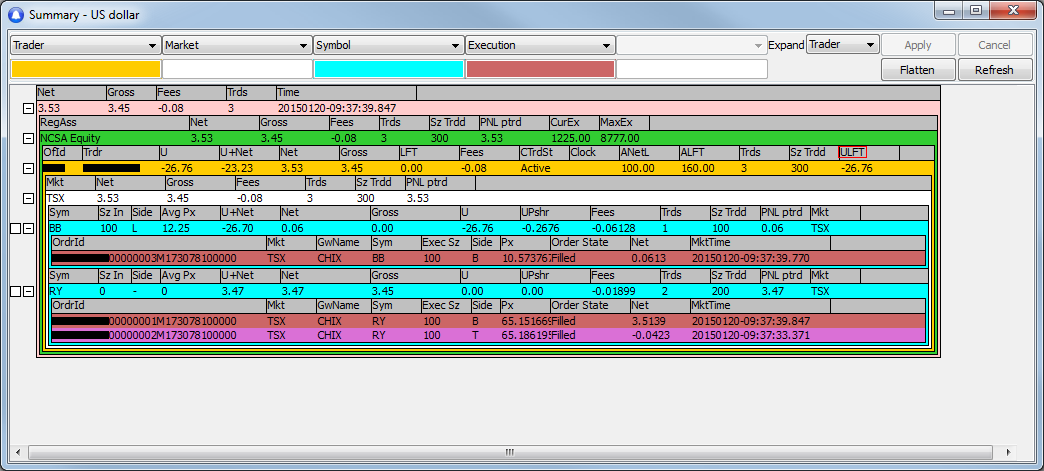
2. Summary窗口出现。
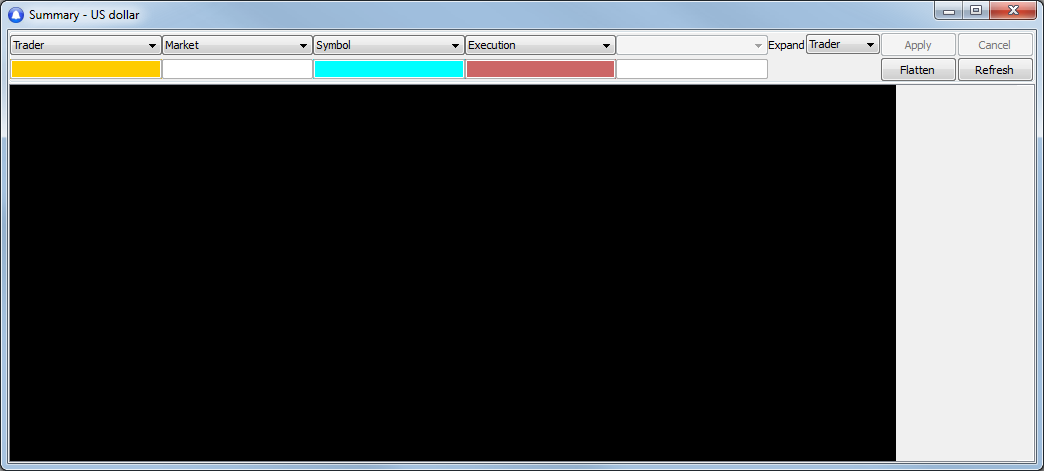
*注意:概览窗口在登录PPro8的时候自动开启,如果您关闭了它,它会再次自动开启。
了解Summary概览窗口的功能
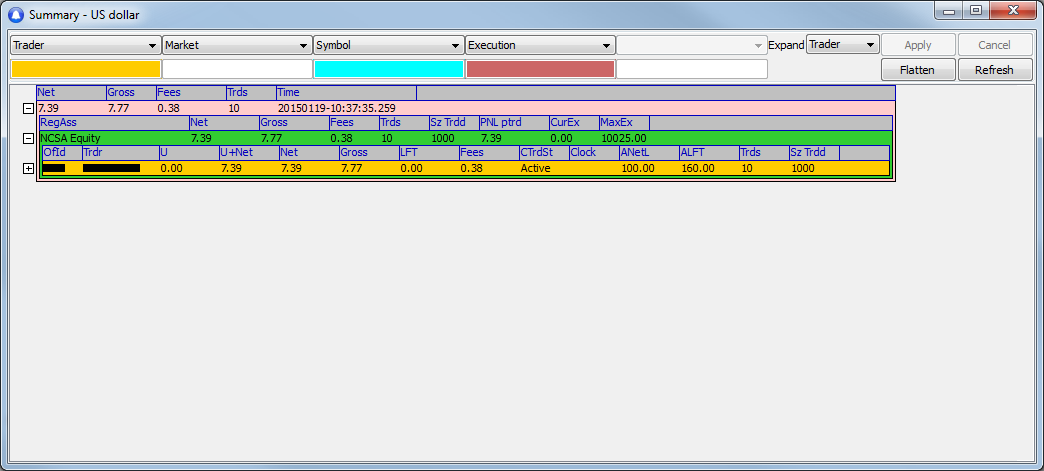
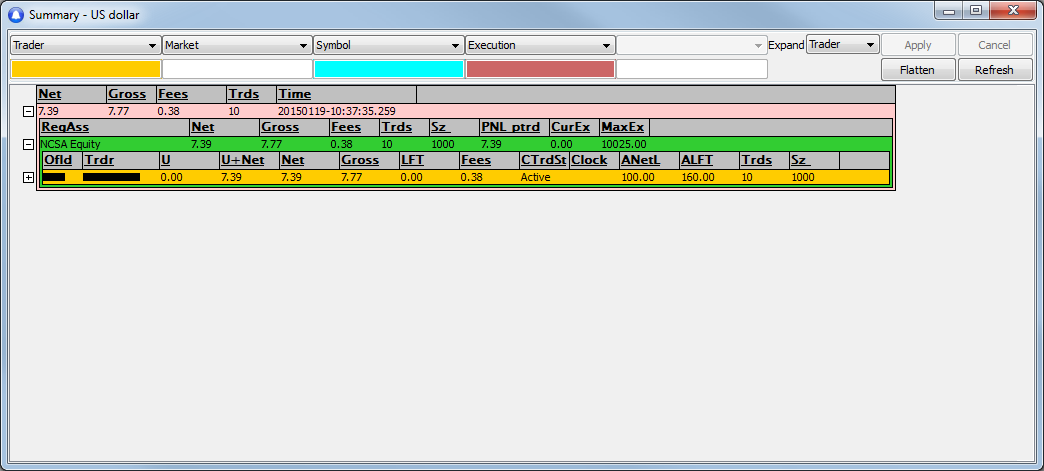
当一个订单被接受的时候,Summary概览窗口自动更新。这个信息在行和层中间按不同颜色显示。而显示的颜色可以个性化设置。
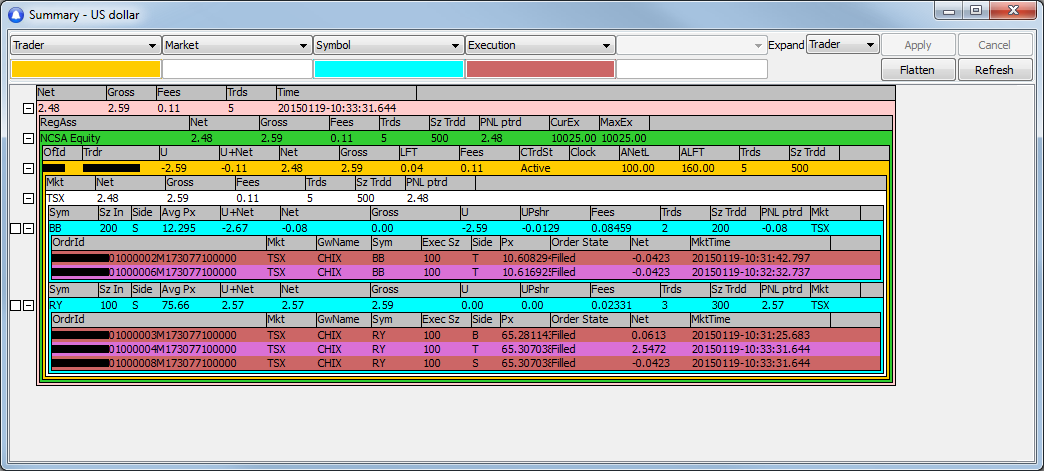
同一类型的汇总信息可以分在不同的行显示。而不同的行可以在同一分层汇总显示交易的信息。
一共有10种行类型:Global Total全球汇总, RegionAsset按地区和资产类别汇总, Trader按交易员账号汇总, Symbol按代码汇总, Office按交易室汇总, Market按市场汇总, Executions显示每一次成交, Currency按货币汇总, Account按交易账号汇总, Position显示所有的仓位。
分层下面可以把同类的不同行的信息综合汇总显示。
您可以点开行前的+号来查看下一层包含的更详细的信息。Execution成交层永远是最下面的交易信息层。
第一层: 第二层: Execution成交记录
第一层将下面各层的数据按层的属性汇总。第二层将所有的交易记录按层的属性汇总。
For Trader交易员第一层: Symbols代码第二层: Execution
第一层显示交易员的汇总信息,第二层显示各个交易员的所有代码上的汇总信息。第三层显示每个代码上所有的成交信息。
扩展或者缩略行信息
您可以扩展或者缩略行的信息。点击“+“号就可以看到扩展后下面一层的数据。
- 缩略时Summary窗口的行边上有一个”+“号:

- 扩展时Summary窗口的行边上有一个”-“号:

Buttons按钮
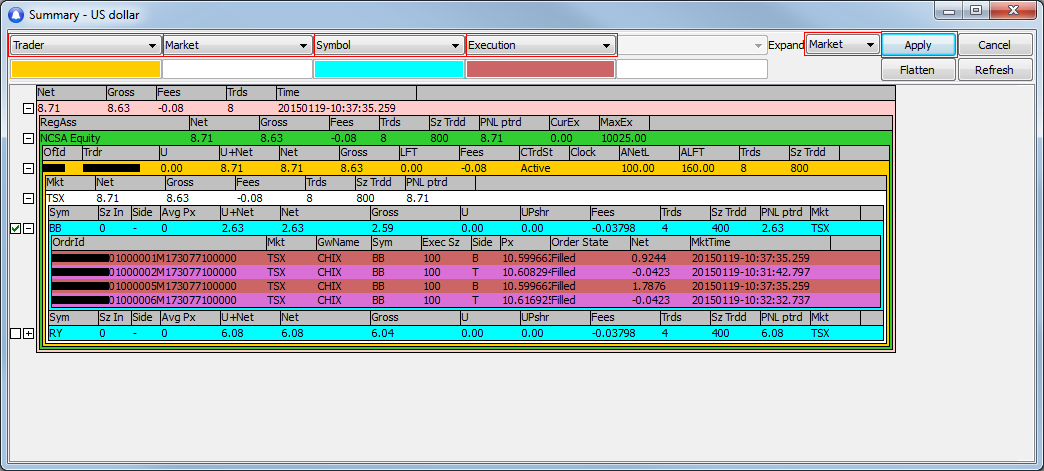
Apply:在选择好了显示的层类后,点击Apply应用来让新的显示层类生效。当您点下Apply,这个按钮暂时变灰。当您调整层类以后,这个按钮会恢复正常。
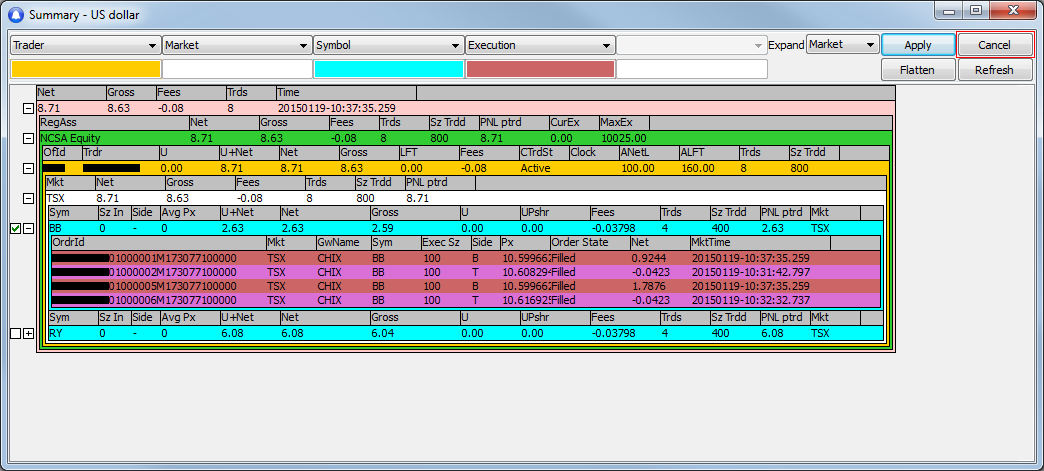
Cancel: 点击一行前面的方框,再按Cancel将恢复到上一次的筛选显示格式。
Flatten: 选择一行前面的方块,再按Flatten即可平仓。
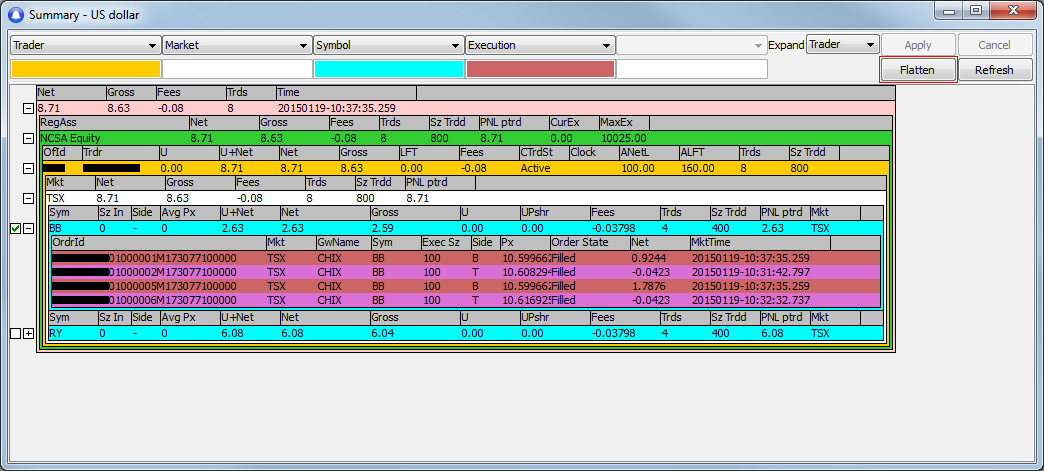
您也可以右键单击一行,然后选择Flatten Selected平掉选中的仓位;或者用键盘热键Ctrl + Shift + F平仓
*注意: 为了避免错误平仓,只有选中Symbols代码、Office交易室、或者Trader交易员行的时候才能使用平仓按钮。
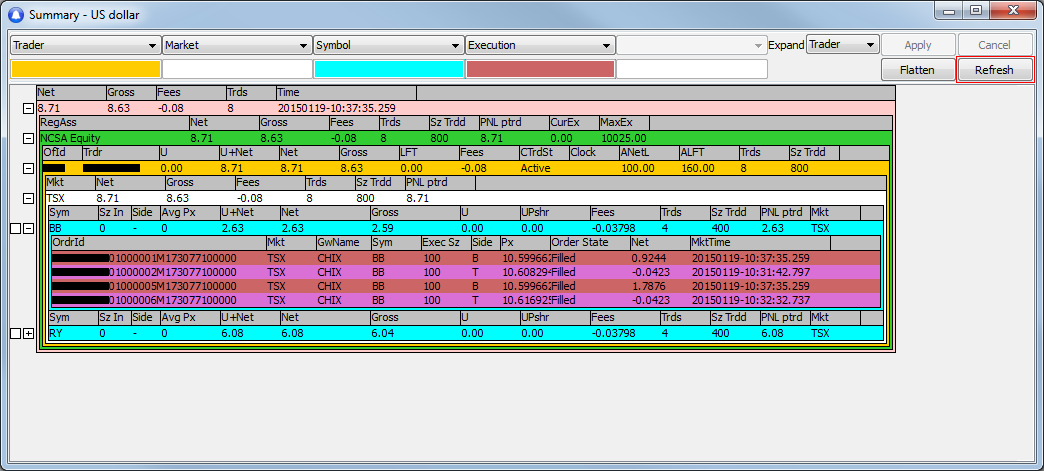
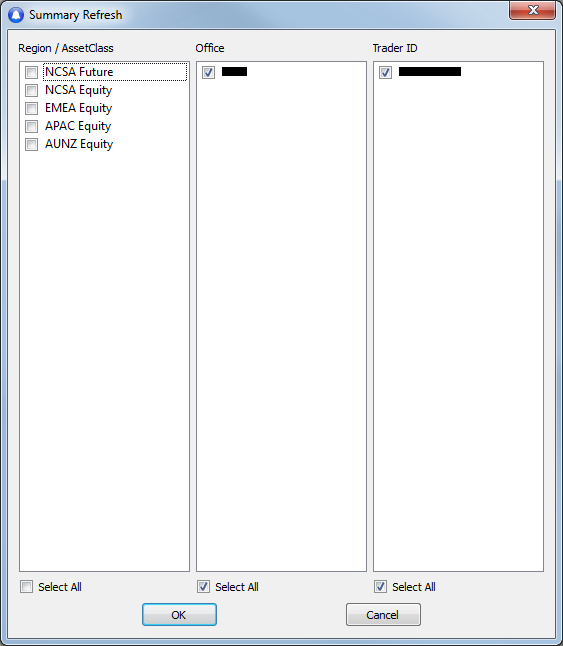
Refresh: 用Refresh刷新指定的交易员(们)的交易记录。当您断网或者有理由相信Summary的数据有误的情况下可以用这个按钮。点击Refresh开启Summary Refresh窗口。
窗口有三大块:Region / AssetClass区域和资产类别、Office交易室、和Trader ID交易员代码。
- Region / AssetClass 显示所有可以交易的市场区域和资产类别
- Office 显示您可以查看的所有交易室
- Trader ID 显示您选中的交易室中所有的交易员代码。
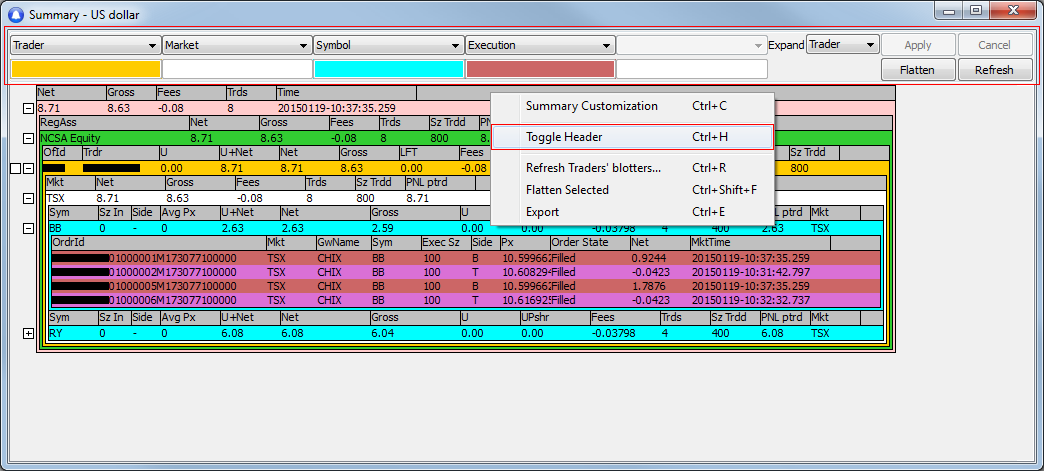
您也可以在一行中右键单击,然后点击Refresh Traders’ blotters刷新交易员的Blotter记录;或者用键盘热键组合Ctrl + R。
Toggle Header: 您可以右键单击一行,选择Toggle Header切换抬头;或者用键盘热键组合Ctrl + H。
Summary窗口的个性化设置
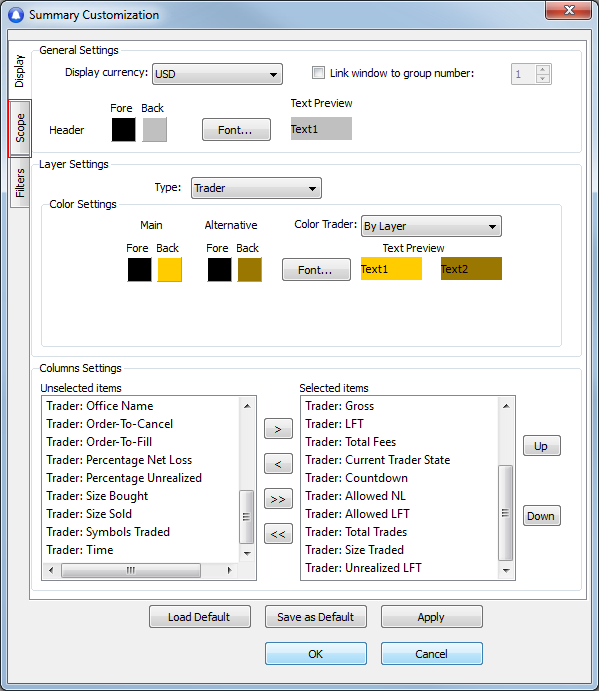
To make changes to the Summary settings, right-click anywhere in Summary, and then click Summary Customization to open the Summary Customization window. You can also open it by using the keyboard shortcut Ctrl + C.
This window displays three main tabs on the left: Display, Scope, and Filters.
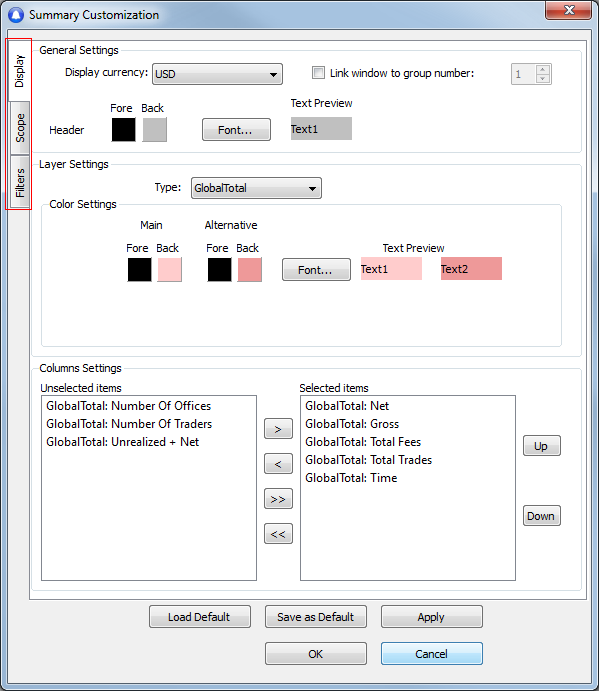
Display
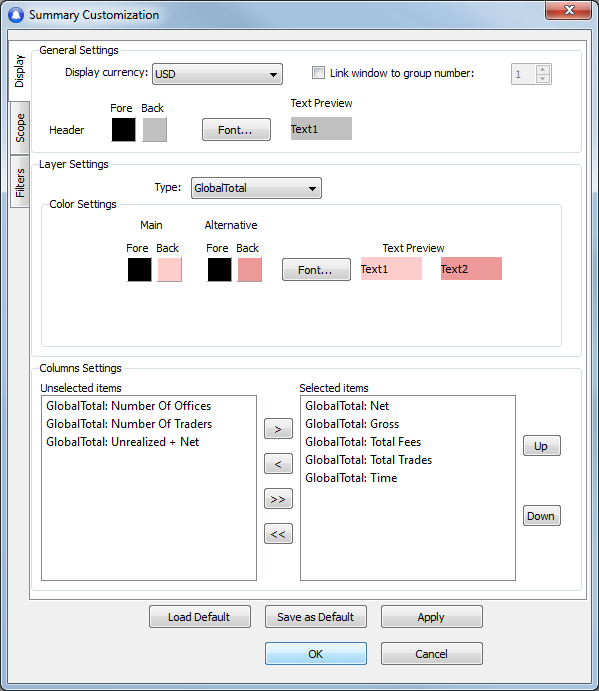
Use the Display window to set the display settings for Summary.
- Click the Display tab to open the Display window.
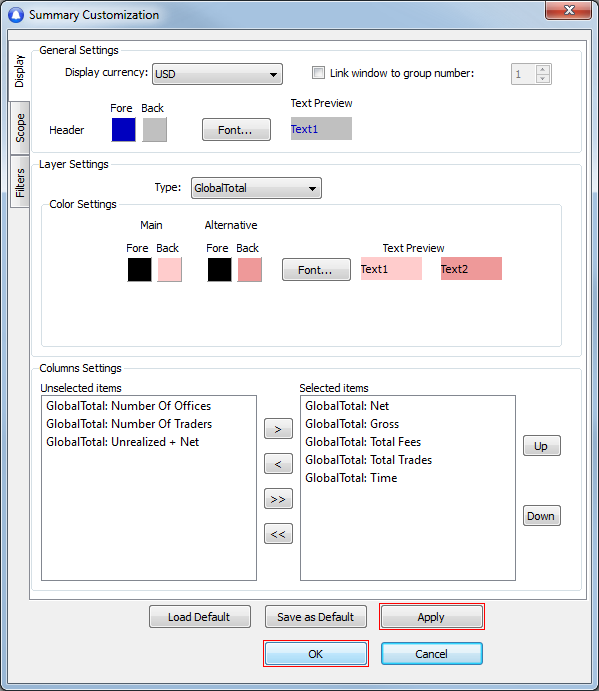
The Display window contains three components: General Settings, Layer Settings, and Columns Settings.
A. General Settings
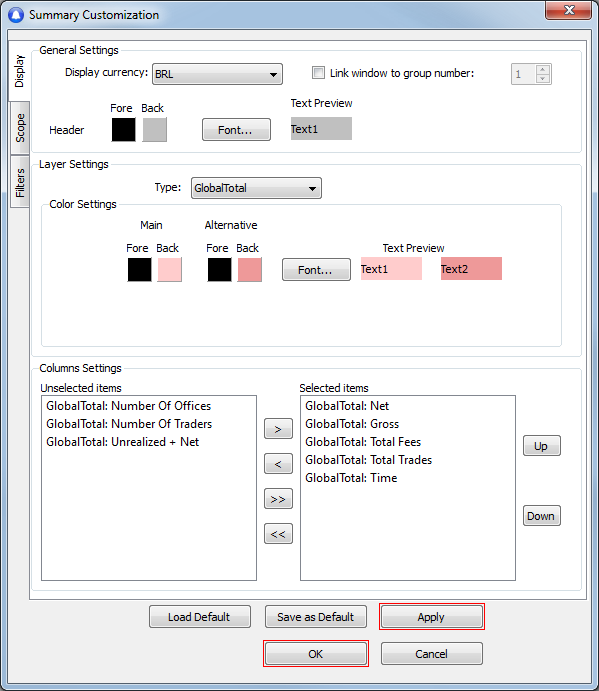
Change display currency
1. Click the currency you want to set.
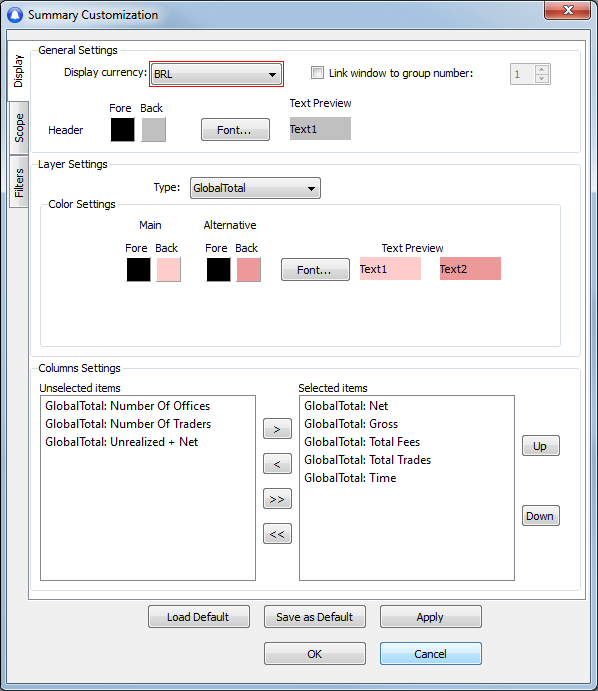
2. Click Apply, and then click OK.
3. The new display currency appears.
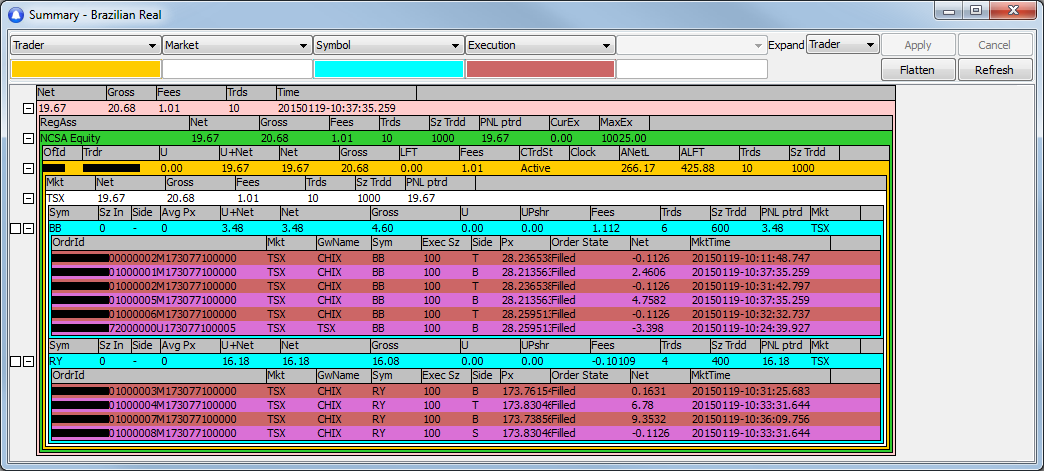
*Note: the default currency in Summary is USD. Other windows in PPro8 display the local currency specific to the market of the symbol being tracked.
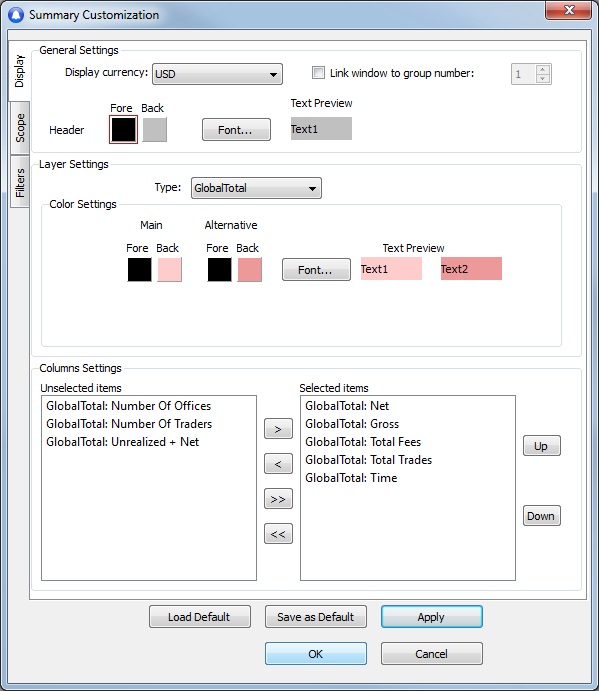
Set a color for the Header
1. Double-click the color box next to a feature, for example, Fore (foreground).
2. The Color dialog window appears. Click a color, and then click OK.
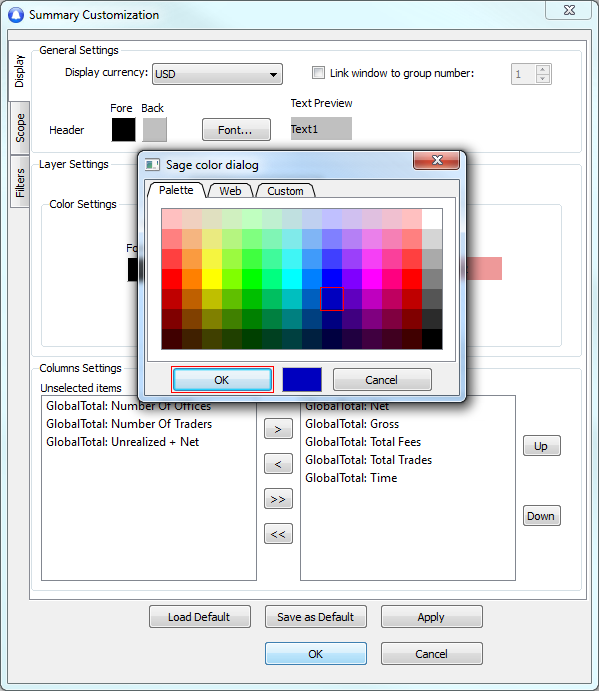
3. In the Summary Customization window, click Apply, and then click OK.
4. The color is set.
Set a font for the Header
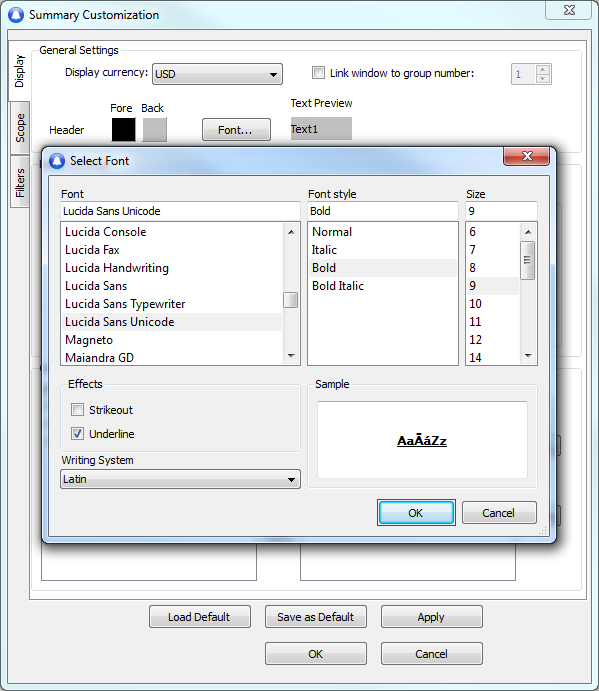
1. Click Font….

2. The Select Font window appears.
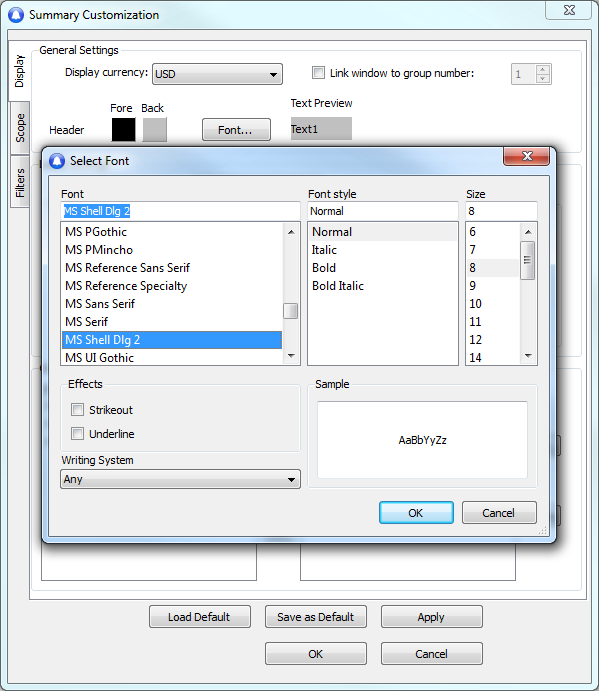
3. Click the font, font style, size, effects, and writing system you want to set.
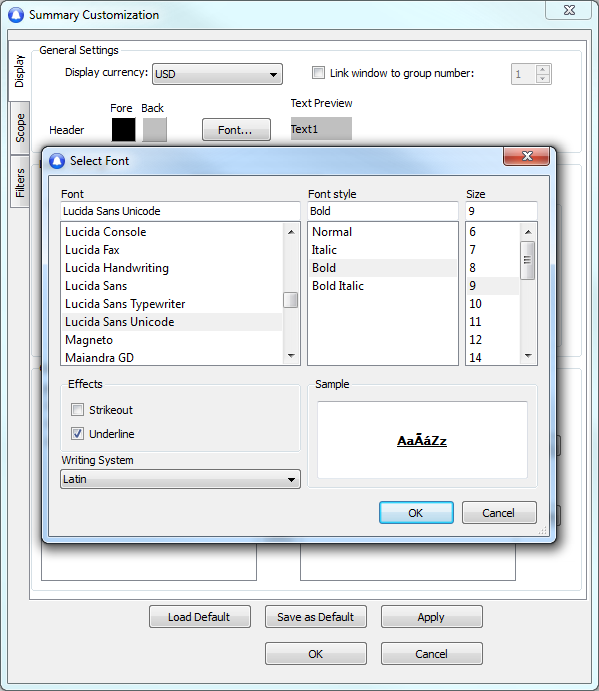
4. Click OK.
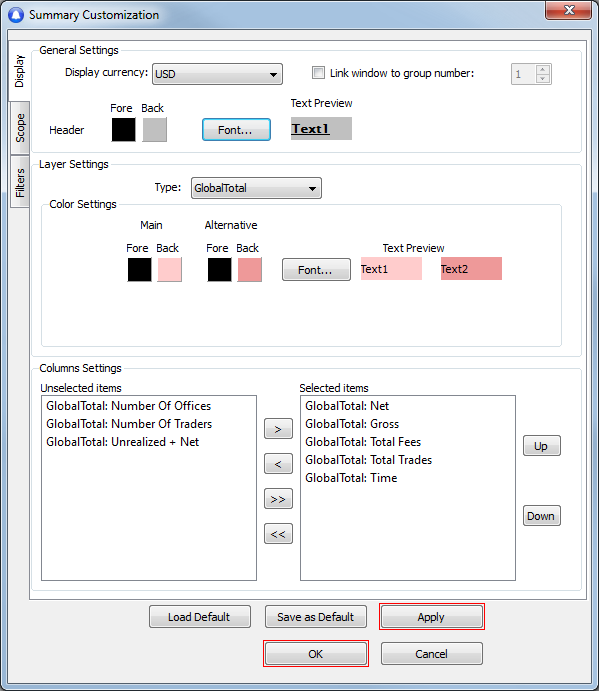
5. Click Apply, and then click OK.
6. The new font appears in the Summary window.
B. Layer Settings
Set a color for a layer setting type
1. Click a layer settings type, for example, Market.
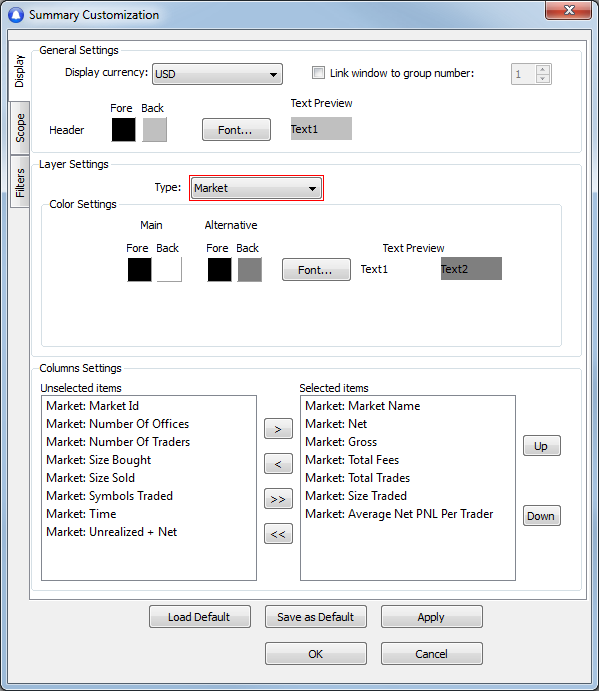
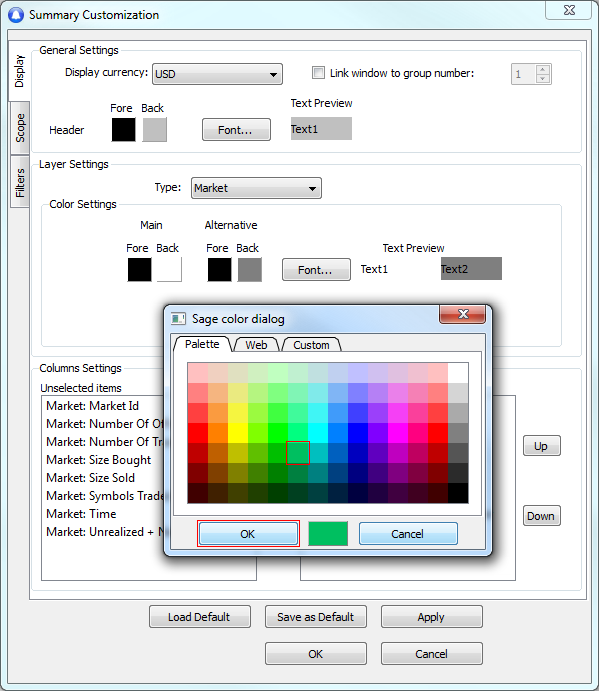
2. Double-click the color box next to a feature, for example, Back (background) under Main.
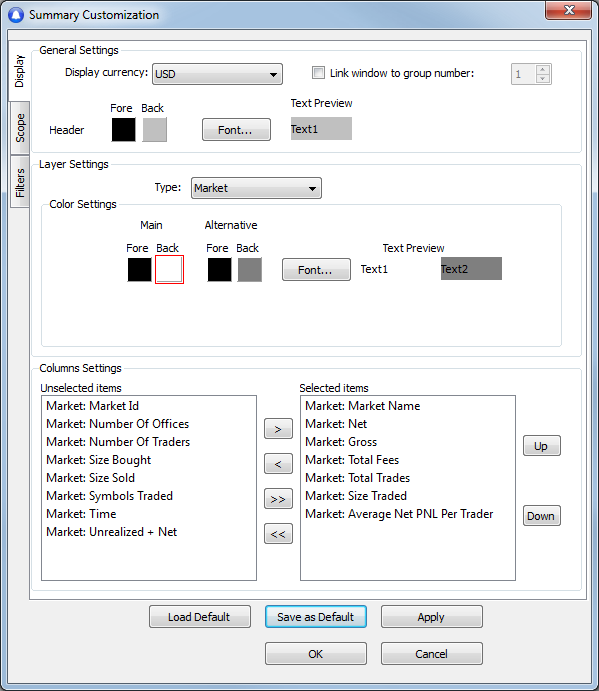
3. The Color dialog window appears. Click a color and then click OK.
4. Click Apply, and then click OK.
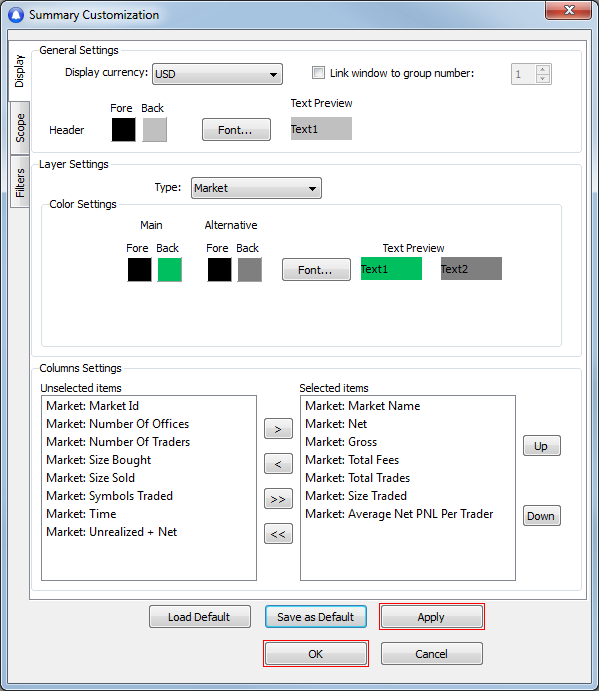
5. The color is set.
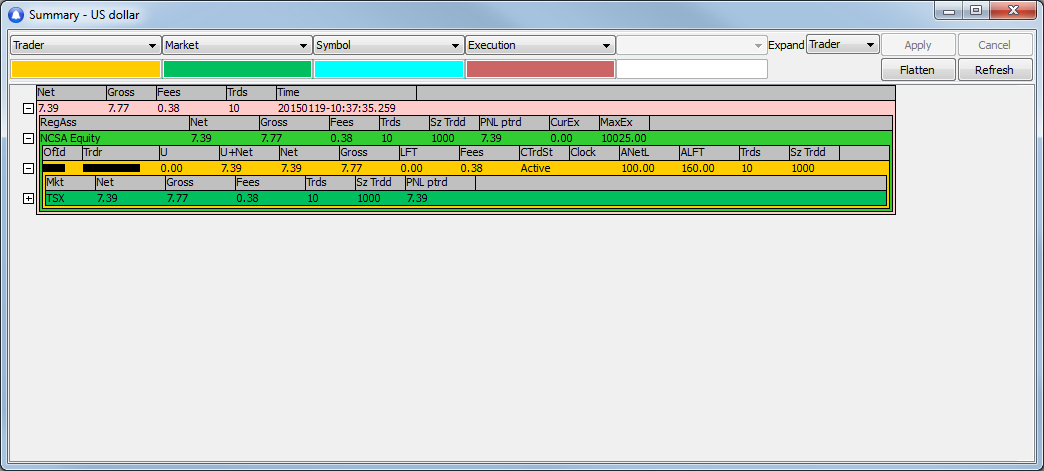
C. Columns Settings
Show a column in Summary
1. Click an item in the Unselected items list.

2. Click the right arrow to move the item to the Selected items list.
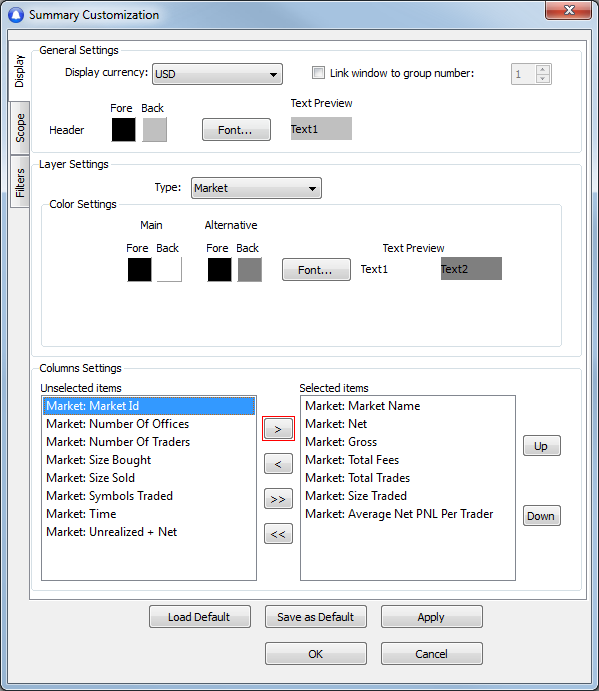
3. Click Apply, and then click OK.
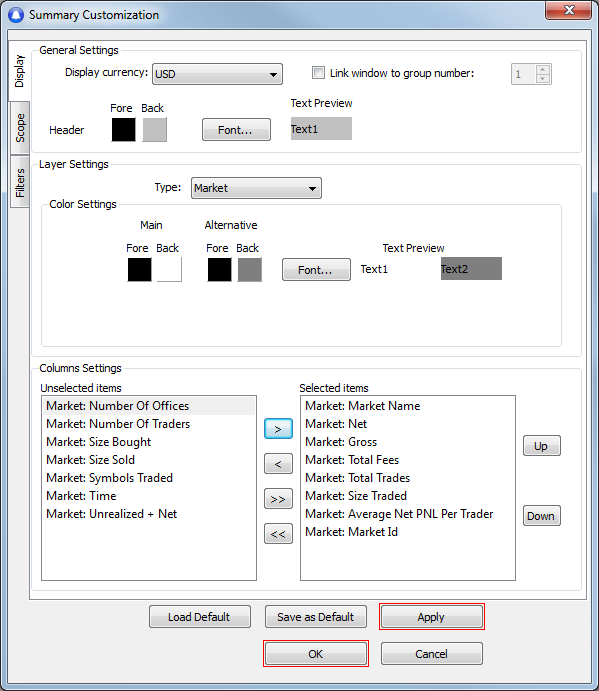
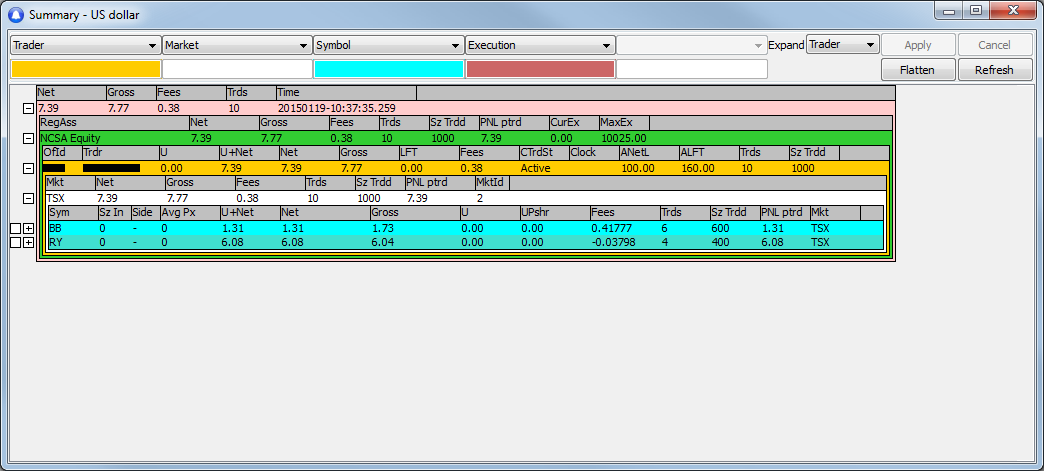
4. The column appears in the Summary window.
Hide a column in Summary
1. Click an item in the Selected items list.
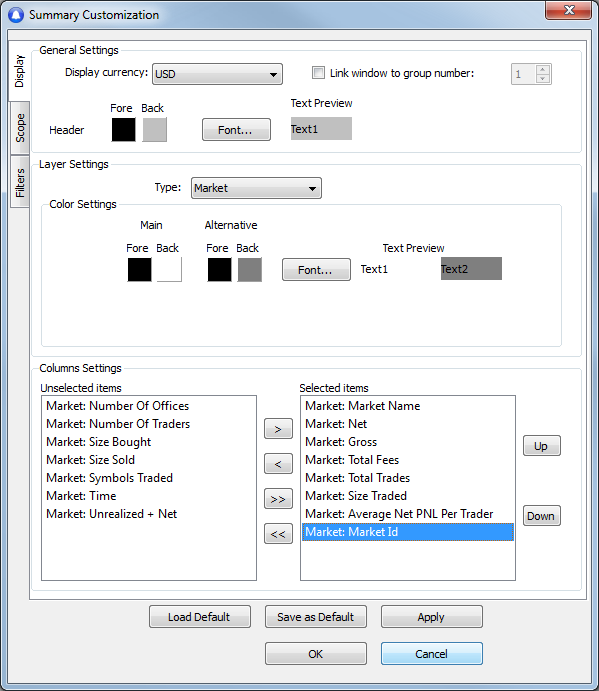
2. Click the left arrow to move the item to the Unselected items list.
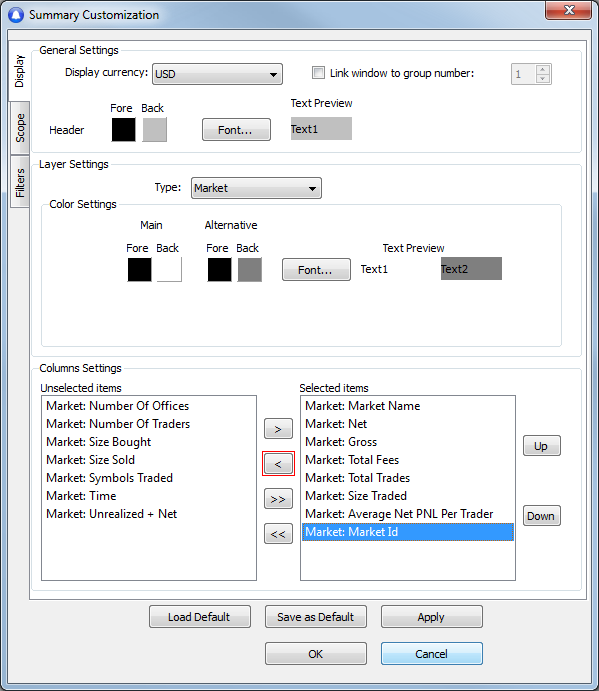
3. Click Apply, and then click OK.
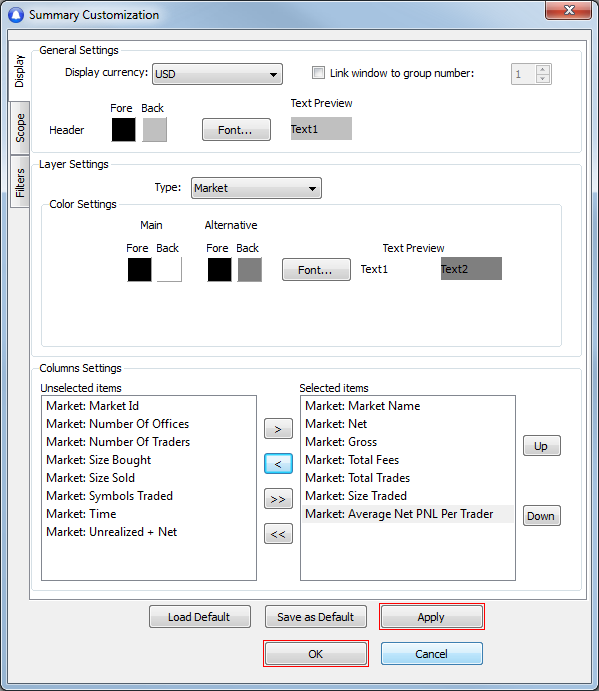
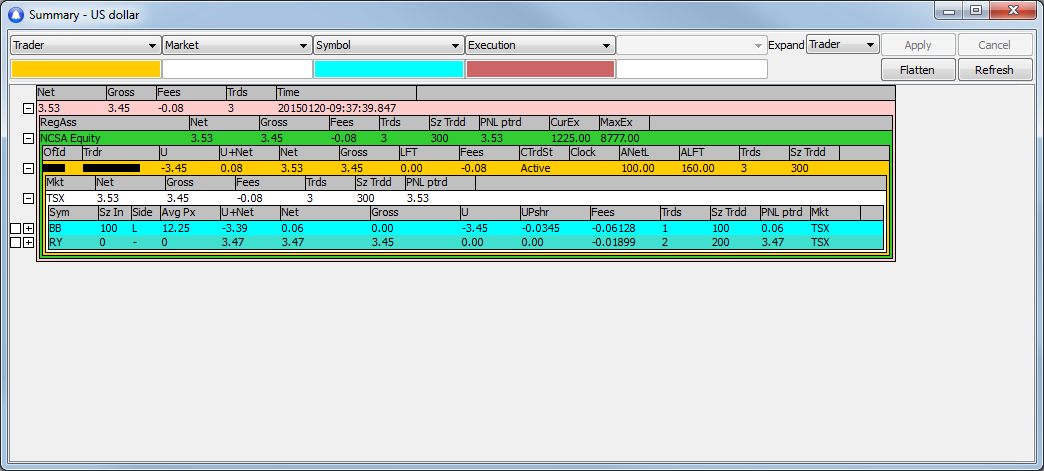
4. The column is hidden from the Summary window.
Unrealized gains and losses
There are two important features in the Summary window: U+Net and ULFT.
1. Unrealized + Net (U+Net) appears in the GlobalTotal, RegionAsset, Office, and Market layers.
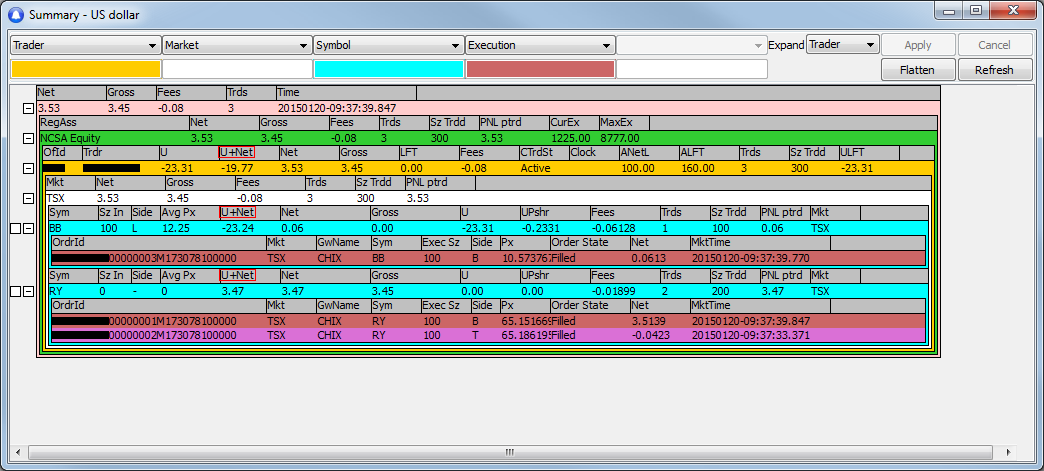
2. Unrealized + Loss From Top (ULFT) is in the trader layer. It shows the trader how close they are to their Allowed Loss From Top (ALFT) risk limit.
Scope
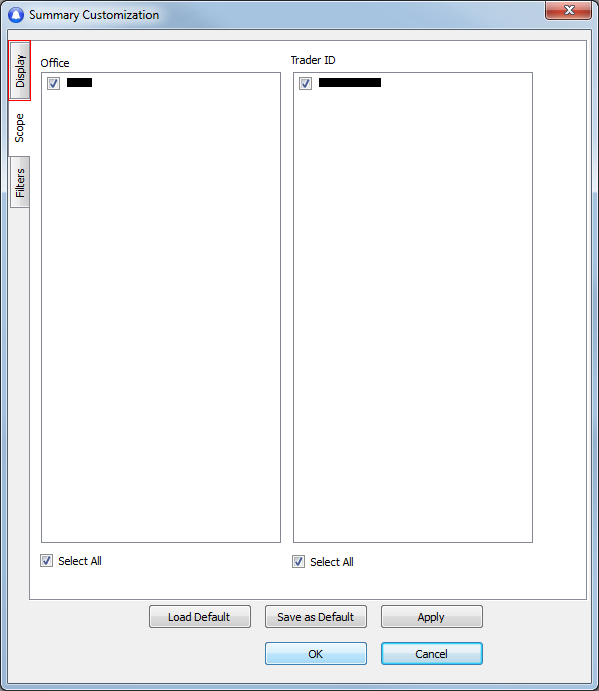
Managers or Operations staff who have the necessary permissions can use the Scope window to limit the offices and trader IDs that appear in Summary and focus on a particular subset of traders in a certain office.
- Click the Scope tab to open the Scope window.
The Scope window contains two panes: Office and Trader ID.
The Office pane shows the offices that a user has permission to see, and the Trader ID pane shows all the traders in the selected office.
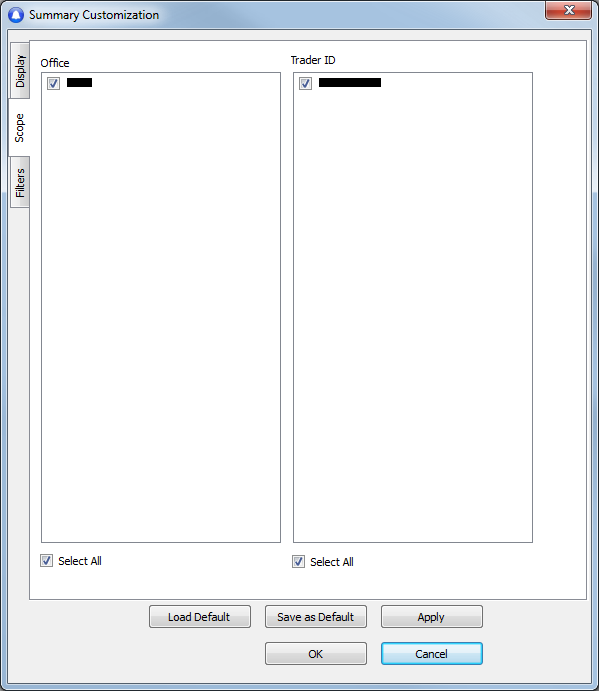
When a change is made to scope, Summary rebuilds using only the OSTATS (order statuses) that match the selected office and trader IDs.
By default, all Offices and all Trader IDs appear as selected in the Scope window.
Filters
Use the Filters window to set filters based on the various row types.
- Click the Filters tab to open the Filters window.

Items in this section vary depending on the Row Type selected.
1. If Row Type = Trader
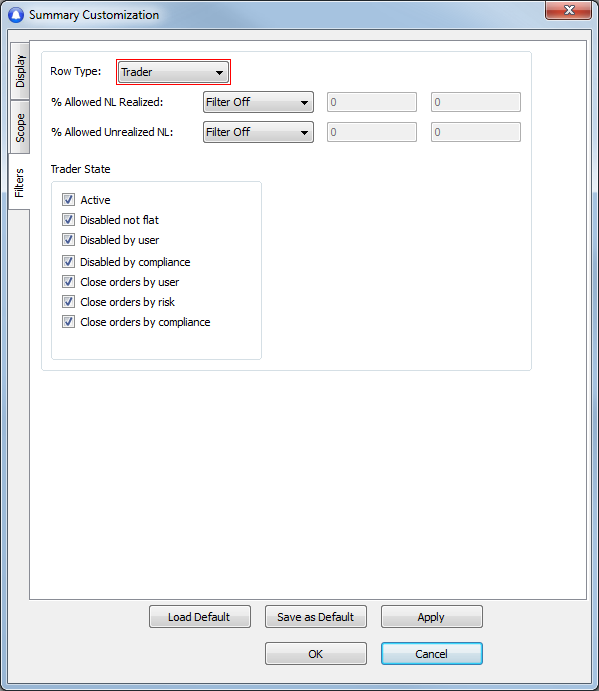
% Allowed NL Realized: if filter is off, all % of allowed NL realized appears. If filter is on, the % set by such conditions appears.
% Allowed Unrealized NL: if filter is off, all % of allowed NL unrealized appears. If filter is on, the % set by such conditions appears.
Trader State
- Active: the trader is active and able to trade.
- Disabled not flat: the trader is disabled. They cannot place any more orders but have an open position.
- Disabled by user: the trader is disabled by either the trader or by their manager.
- Disabled by risk: the trader is disabled by the Risk Team due to NL or LFT.
- Disabled by compliance: the trader is disabled by the Compliance Team due to an illegal trade or other issue.
- Close orders by user: the trader has reached the maximum allowed NL or LFT, or has sent an illegal trade, and has a set amount of time left to flatten the position.
- Close orders by risk: the Risk Team set the trader as “Close Orders by Risk Issue.” The trader can flatten their positions before time runs out.
- Close orders by compliance: the Compliance Team set the trader as “Close Orders by Compliance Issue.” The trader can flatten their positions.
2. If Row Type = Symbol
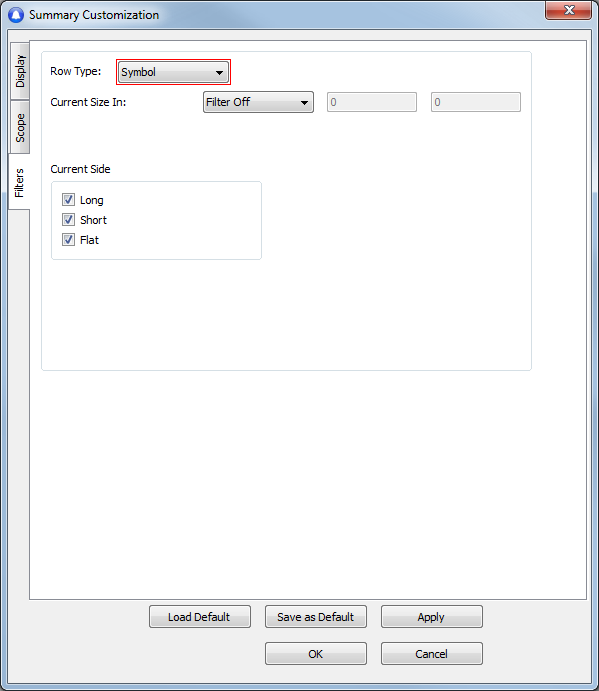
Current Size In: the number of shares the trader trades.
Current Side: when the appropriate check boxes are selected, Summary shows values for Long, Short, and Flat positions.
3. If Row Type = Order
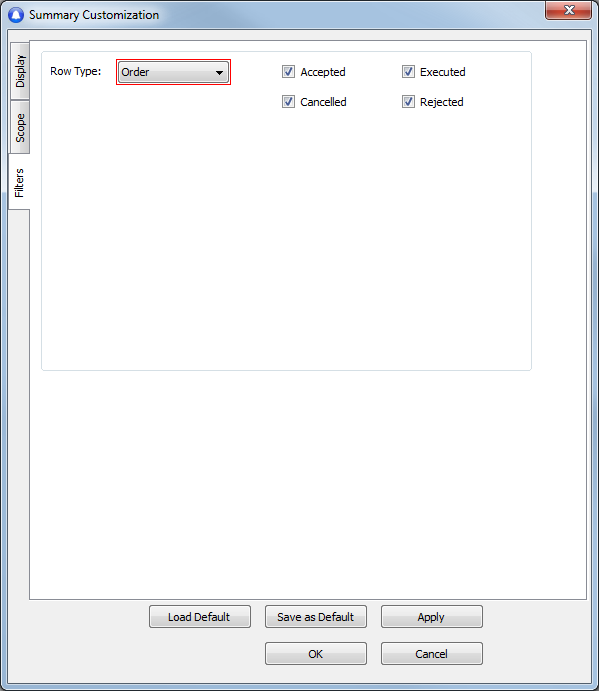
When the appropriate check boxes are selected, Summary shows Accepted, Executed, Cancelled, and Rejected orders.
Export summary data
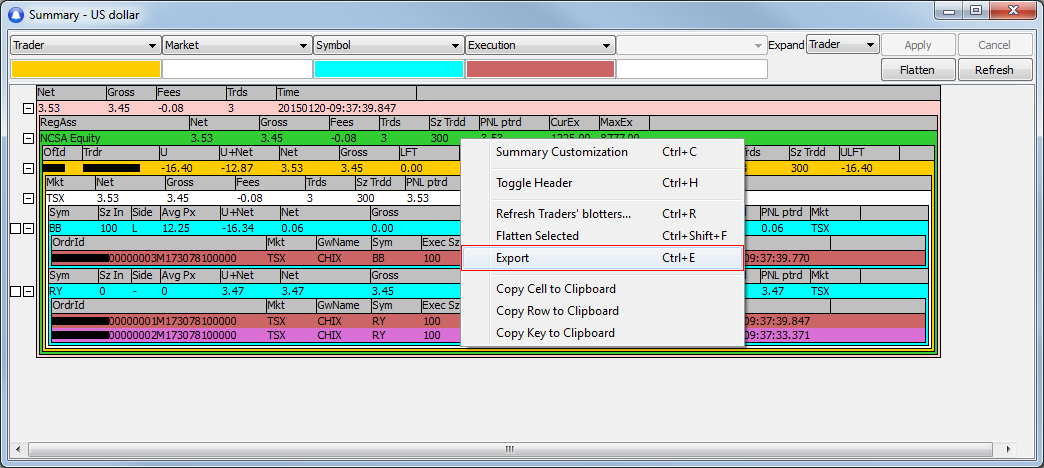
1. Right-click anywhere in the Summary window and click Export; or use the keyboard shortcut Ctrl + E.
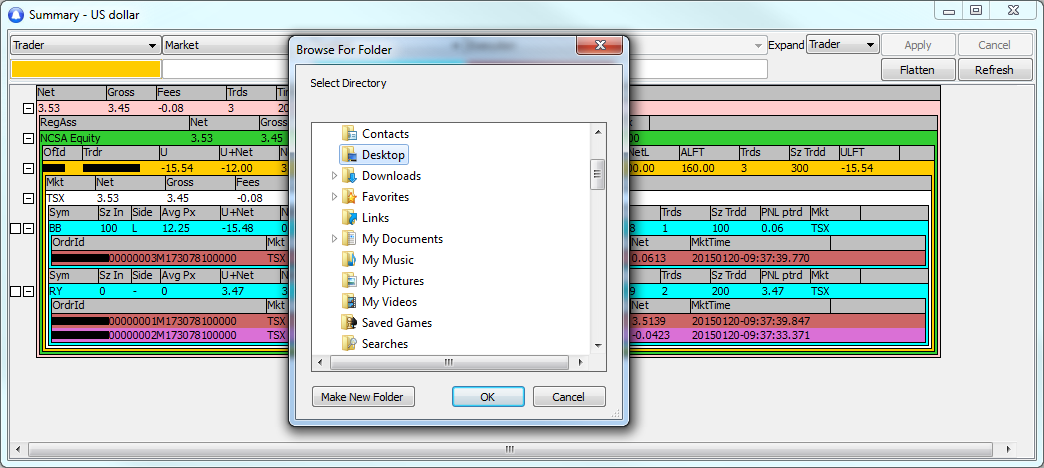
2. The Browse For Folder window appears.
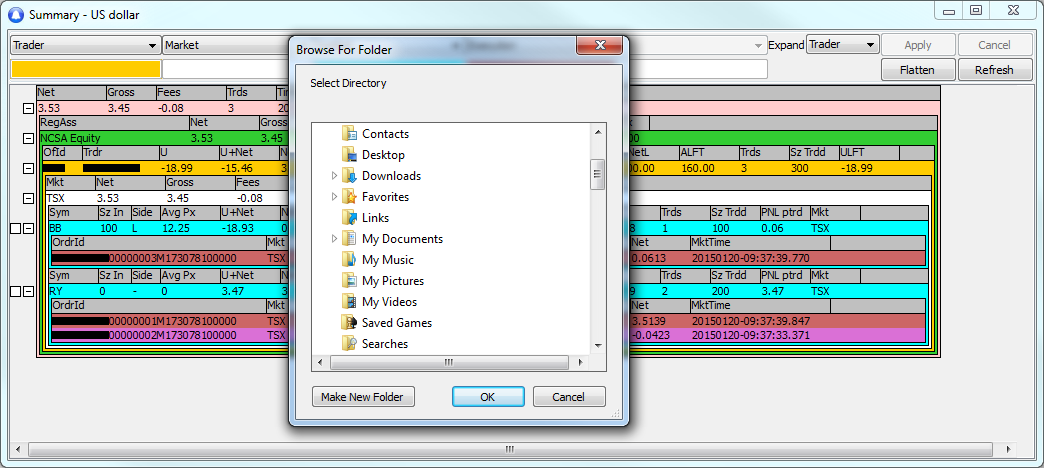
3. Find and click the folder where you want to save summary data.
4. Click OK.
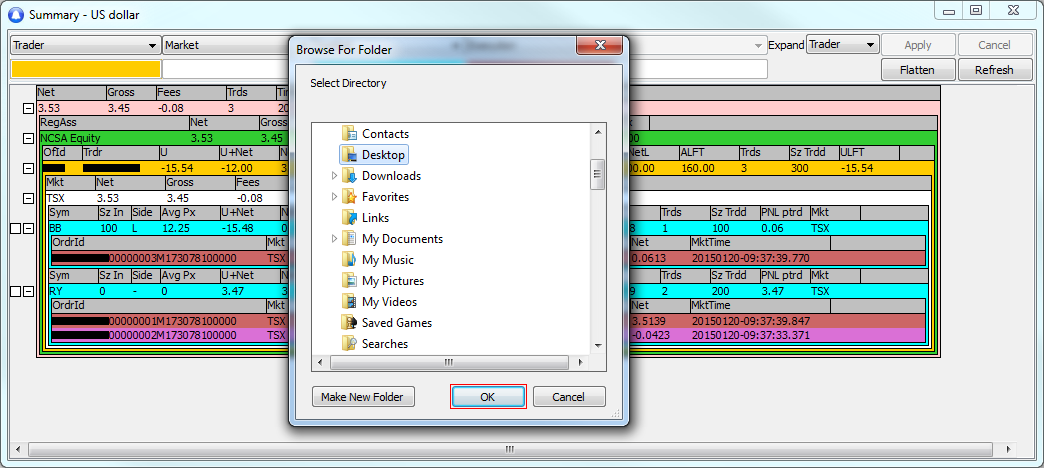
5. The data is exported to CSV files.
*Note: the export process generates one CSV file per summary layer. Each CSV file contains all the columns appearing in a layer, as well as a column for each layer above. The data in these files reflect the current view in Summary. File names are set as follows: “Summary” + layer name + current date, for example, “SummaryGlobalTotal2015-01-13_10-40-34”. Lower-level files include the preceding levels in the file name.
Copy summary data
1. Right-click a cell or row.
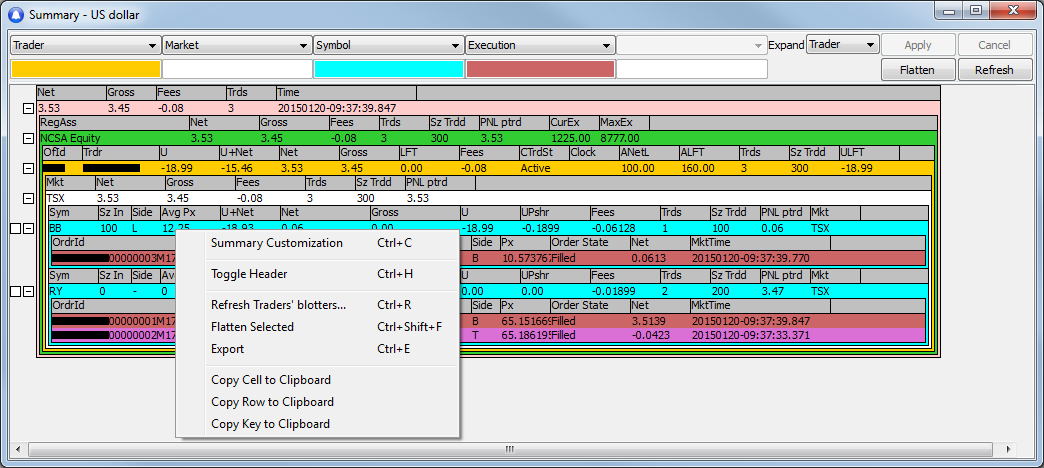
2. Click Copy Cell to Clipboard, or Copy Row to Clipboard, or Copy Key to Clipboard, as needed.
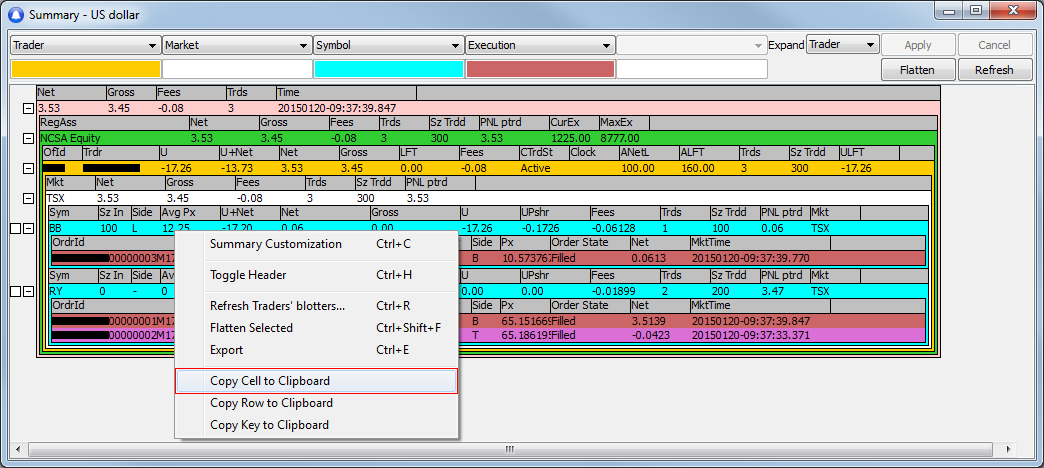
3. The cell, row, or key is copied to the clipboard. You can now copy and paste it where you choose.
