This is an old revision of the document!
Table of Contents
This work is licensed under a Creative Commons Attribution-NonCommercial-NoDerivs 3.0 Unported License.
PPro8 TMS Ticker
The PPro8 Ticker window displays data on a preset list of symbols.
Note: to view values for symbols in the Ticker window, first set up a symbol list in the SymbolsList Editor.
Open a new Ticker window
1. On the PPro8 toolbar, click Ticker.

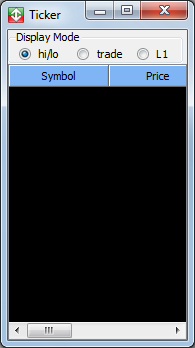
2. An empty Ticker window appears.
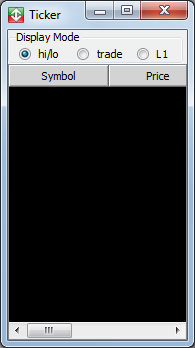
Set the display mode for a Ticker window
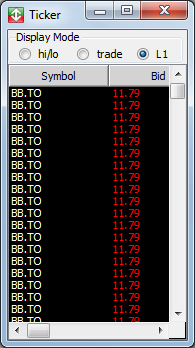
There are three different display modes available for the Ticker window: hi/lo, trade, and L1. Select an option to set the corresponding display mode.
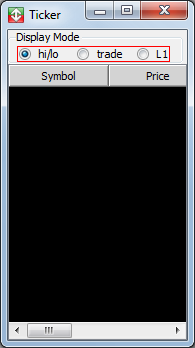
- Hi/lo: this mode shows new highs or lows on a list of symbols. When the hi/lo mode is set, the Ticker window displays Symbol, Price, and Change.
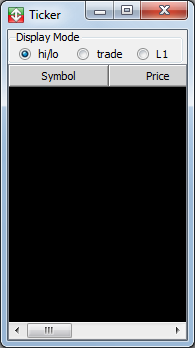
- Trade: this mode shows all trades on the list of symbols being monitored, much like the Time of Sales window. When the trade mode is set, the Ticker window displays Symbol, Price, Shares, and Time.
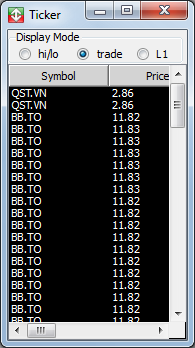
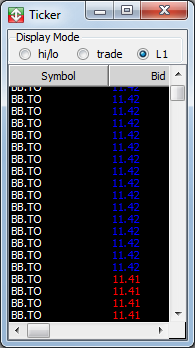
- L1: this mode shows Level1 data on a list of symbols. When the L1 mode is set, the Ticker window displays Symbol, Bid, Ask, Bid Size, and Ask size.
Ticker Window Customization
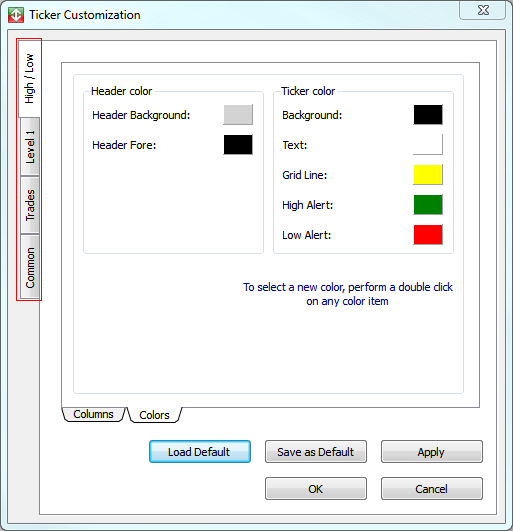
To make changes to the Ticker window settings, right-click anywhere in the Ticker window to open the Ticker Customization window. This window displays four main tabs on the left: High/Low, Level 1, Trades, and Common.
High/Low
Use the High/Low window to set the high/low settings for the Ticker window.
- Click the High/Low tab to open the High/Low window.
The High/Low window contains three sub-tabs: Options, Columns, and Colors.
Options
Use the Options window to enable or disable an alert in hi/lo mode.
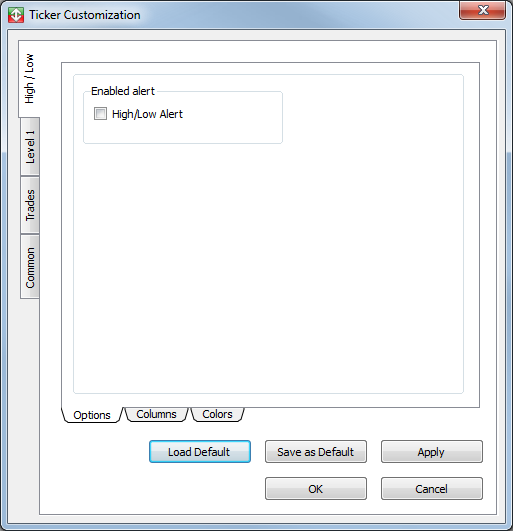
1. Click the Options sub-tab in the High/Low window.
2. The Options window appears.
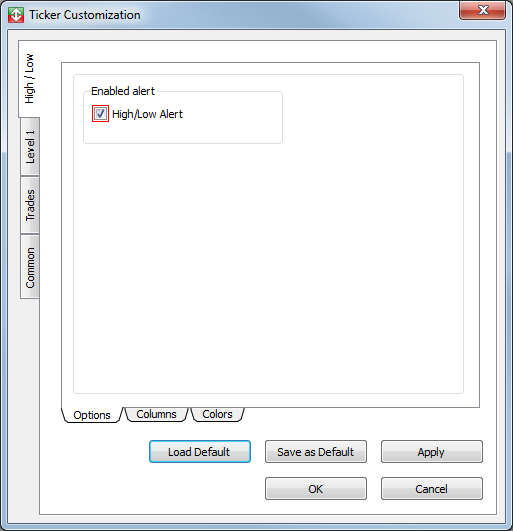
3. Select the High/Low Alert check box to set the alert.
4. Click Apply, and then click OK.
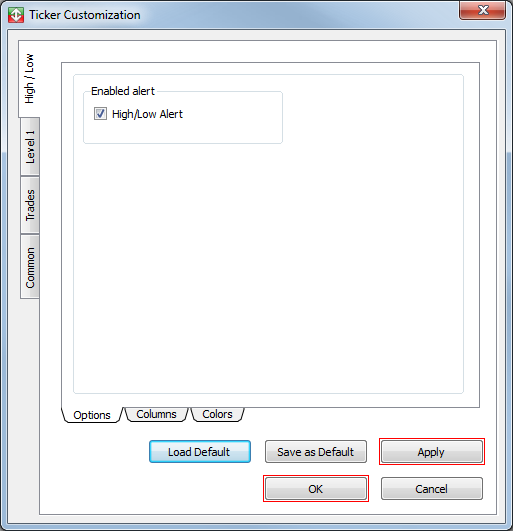
5. The alert is set.
Columns
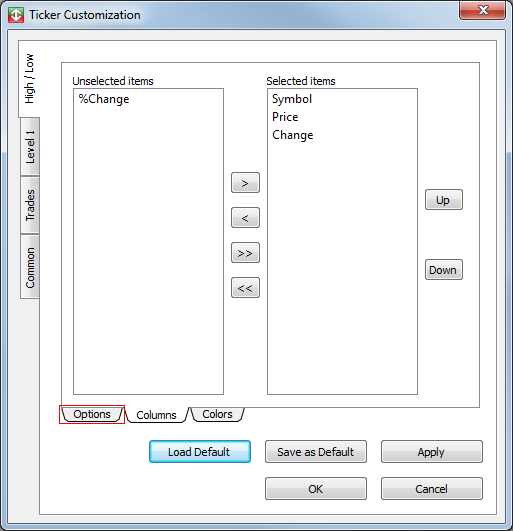
Use the Columns window to show or hide columns in hi/lo mode.
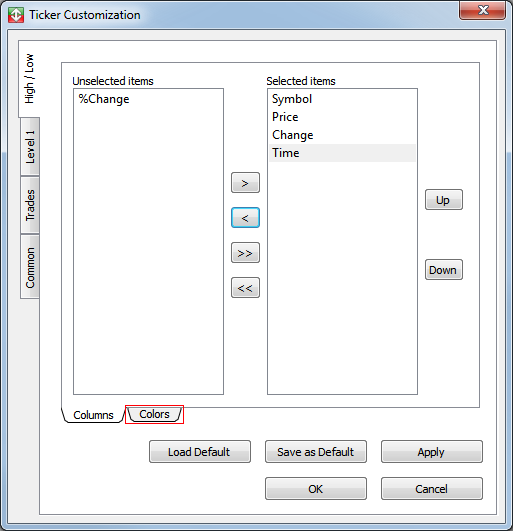
1. Click the Columns sub-tab.
2. The Columns window appears.
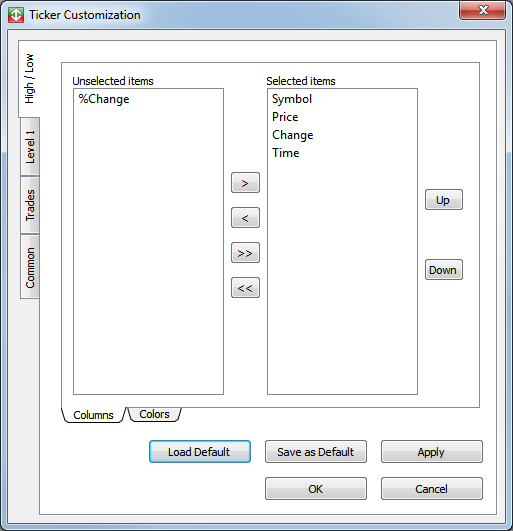
Show a column in hi/lo mode
1. Click an item in the Unselected items list.

2. Click the right arrow to move the item to the Selected items list.
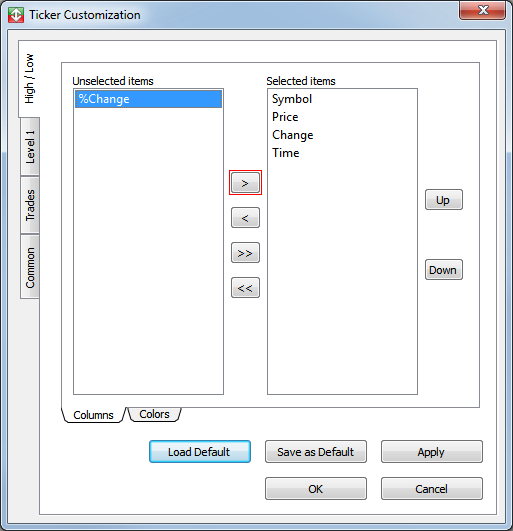
3. Click Apply, and then click OK.
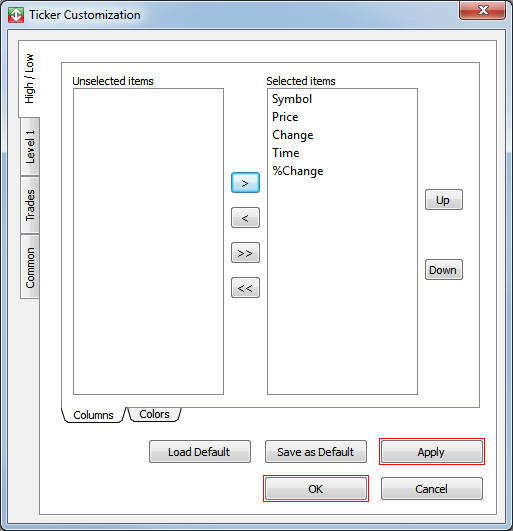
4. The column appears in the Ticker window.

Hide a column from hi/lo mode
1. In the Columns window, click an item in the Selected items list.

2. Click the left arrow to move the item to the Unselected items list.
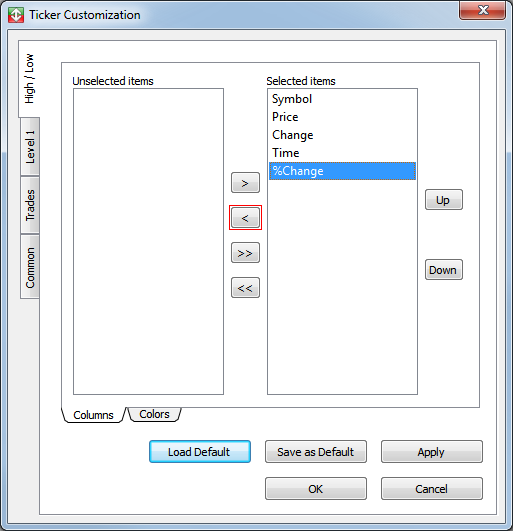
3. Click Apply, and then click OK.
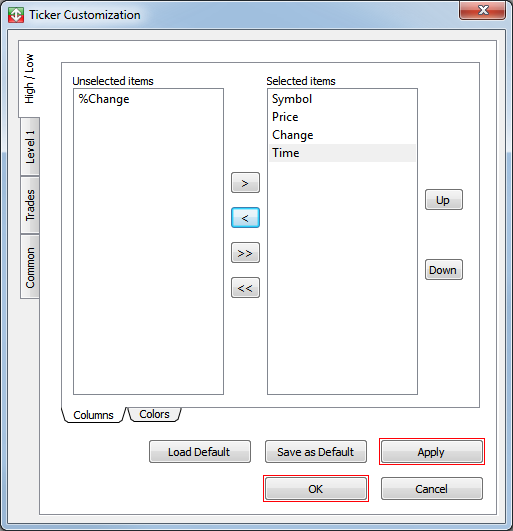
4. The column is hidden from the Ticker window.
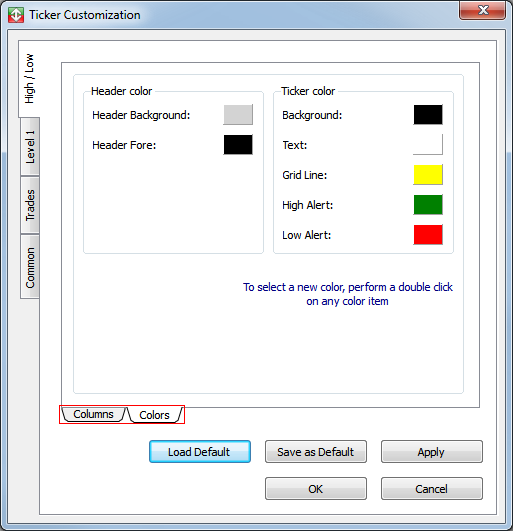
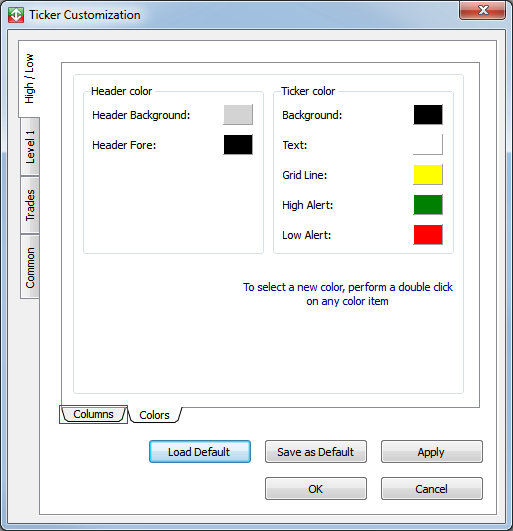
Colors
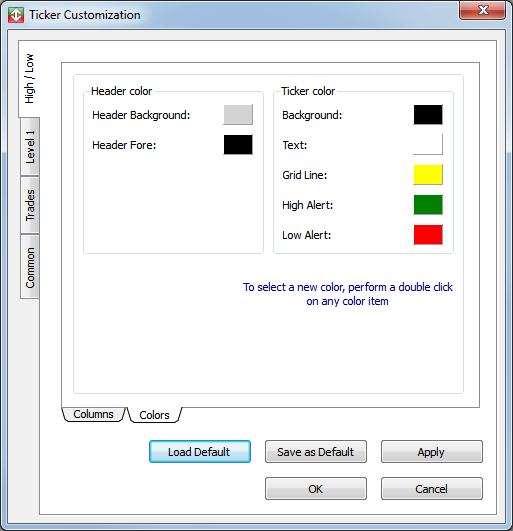
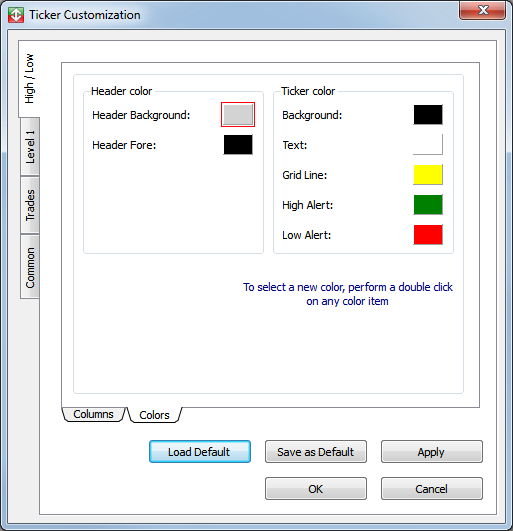
Use the Colors window to set the colors for the header and ticker in hi/lo mode.
1. Click the Colors sub-tab.
2. The Colors window appears.
Set a color in hi/lo mode
1. Double-click the color box next to a feature, for example, Header Background under the Header Color heading.
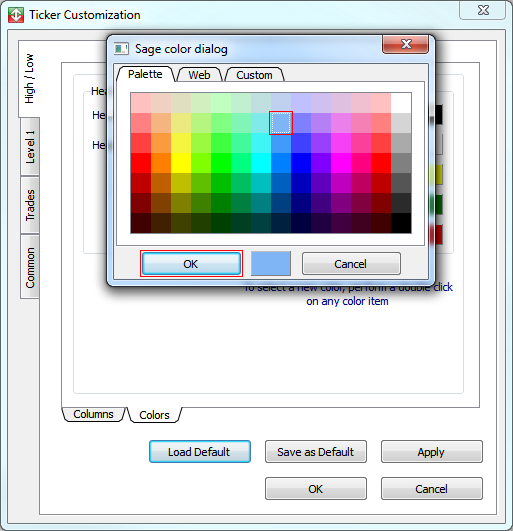
2. The Color dialog window appears. Click a color, and then click OK.
3. In the Colors window, click Apply, and then click OK.
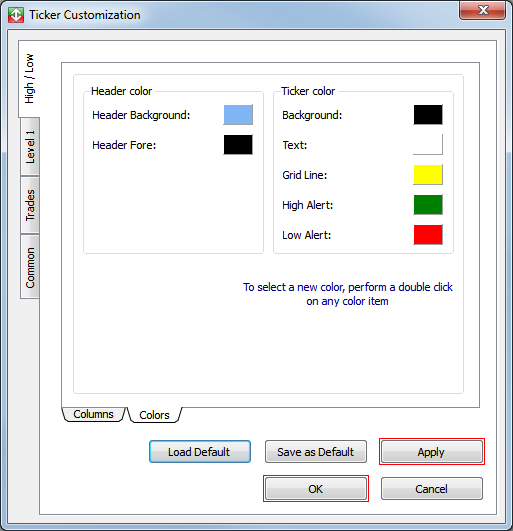
4. The color is set.
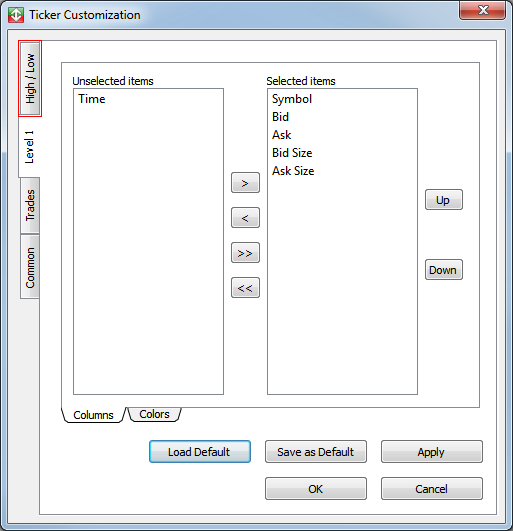
Level 1
Use the Level 1 window to show Level1 data in the Ticker window.
- Click the Level 1 tab to open the Level 1 window.
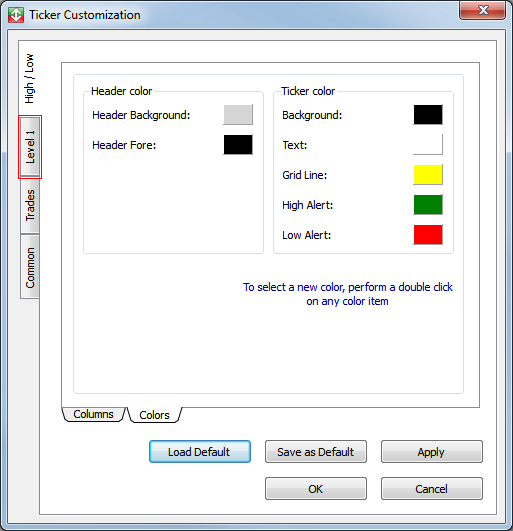
The Level 1 window contains two sub-tabs: Columns and Colors.
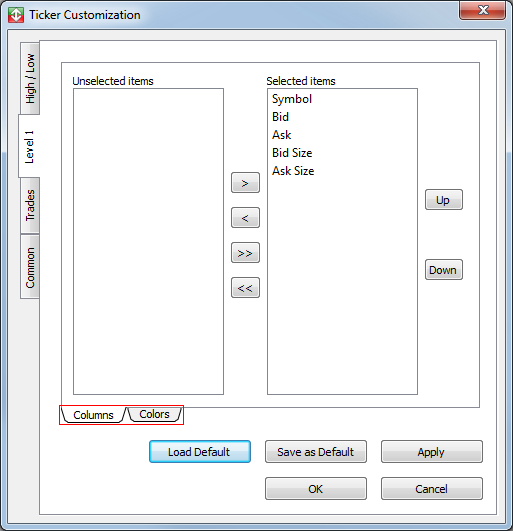
Columns
Use the Columns window to show or hide columns in L1 mode.
1. Click the Columns sub-tab.
2. The Columns window appears.
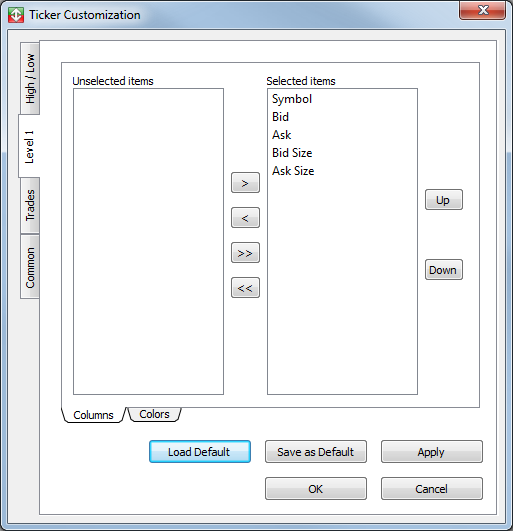
Show a column in L1 mode
1. Click an item in the Unselected items list.

2. Click the right arrow to move the item to the Selected items list.
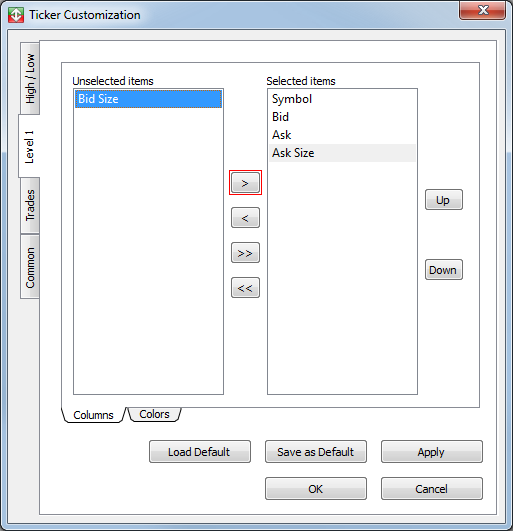
3. Click Apply, and then click OK.
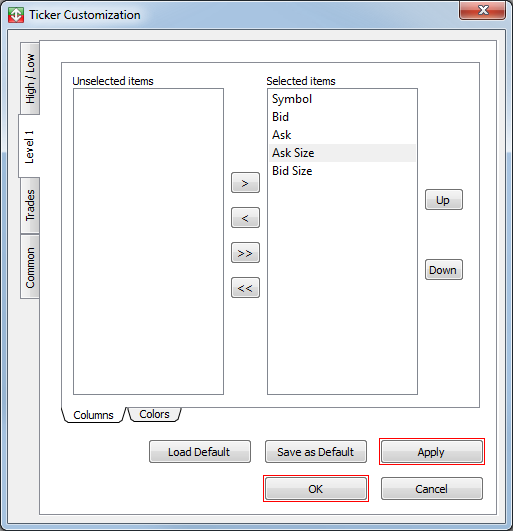
4. The column appears in the Ticker window.
Hide a column from L1 mode
1. Click an item in the Selected items list.
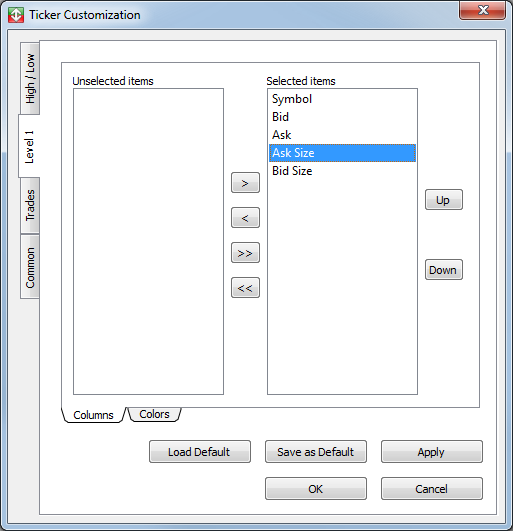
2. Click the left arrow to move the item to the Unselected items list.
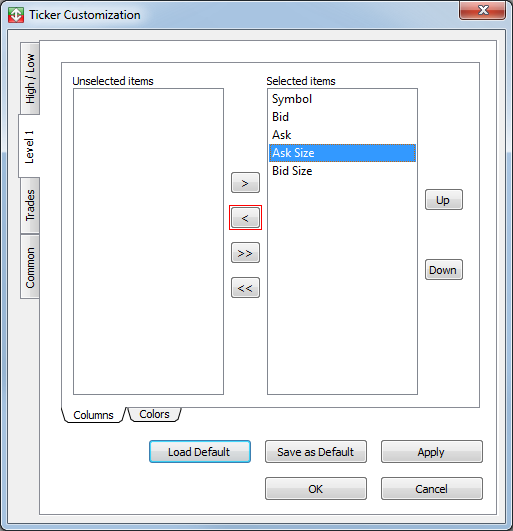
3. Click Apply, and then click OK.
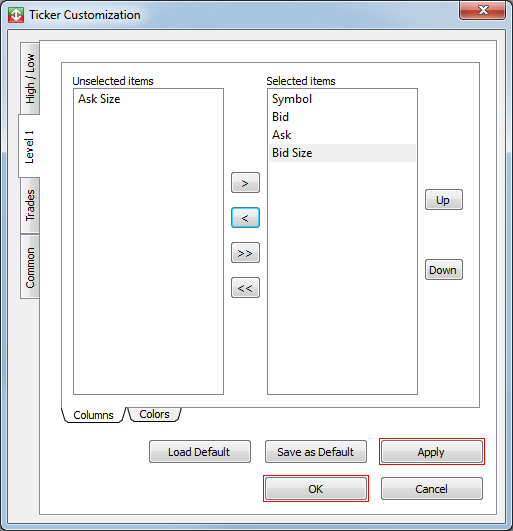
4. The column is hidden from the Ticker window.
Colors
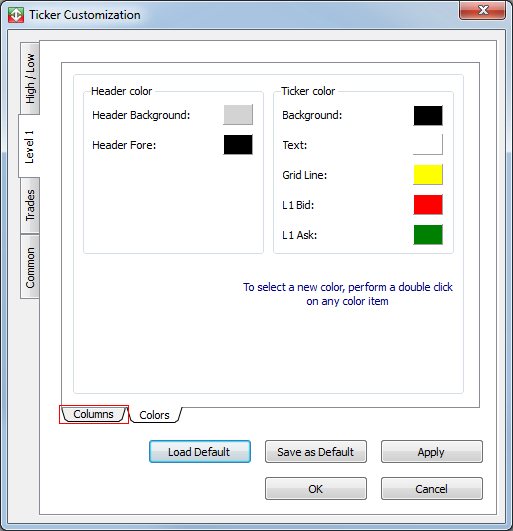
Use the Colors window to set the colors for the header and ticker in L1 mode.
1. Click the Colors sub-tab.
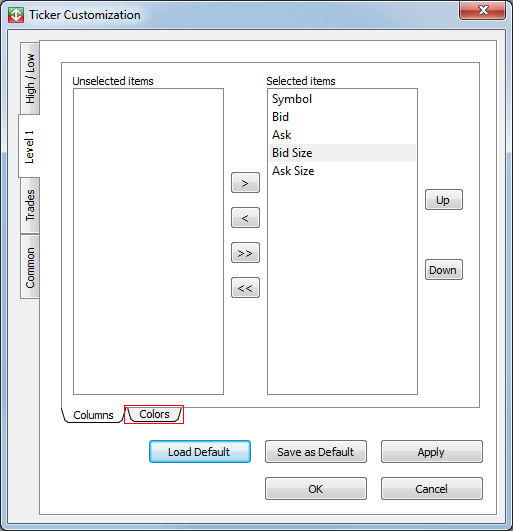
2. The Colors window appears.
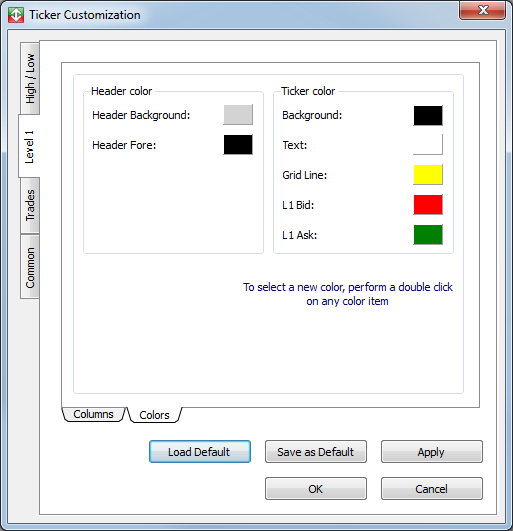
Set a color in L1 mode
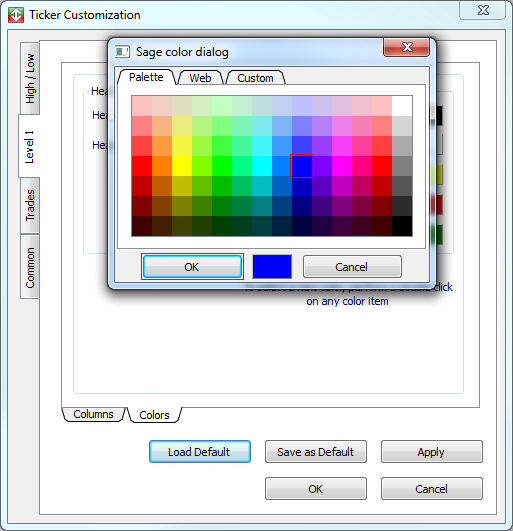
1. Double-click the color box next to a feature, for example, L1 Bid under the Ticker color heading.
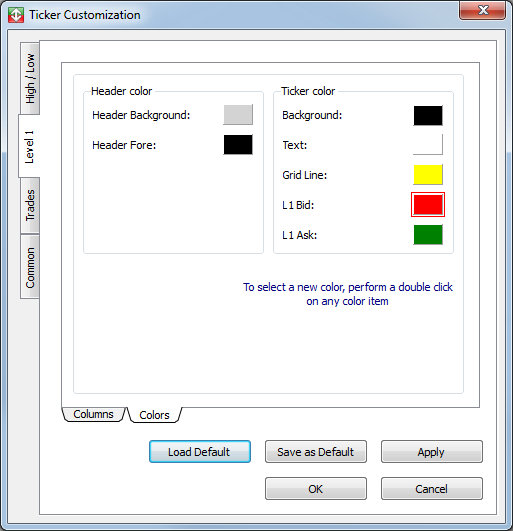
2. The Color dialog window appears. Click a color, and then click OK.
3. In the Color window, click Apply, and then click OK.
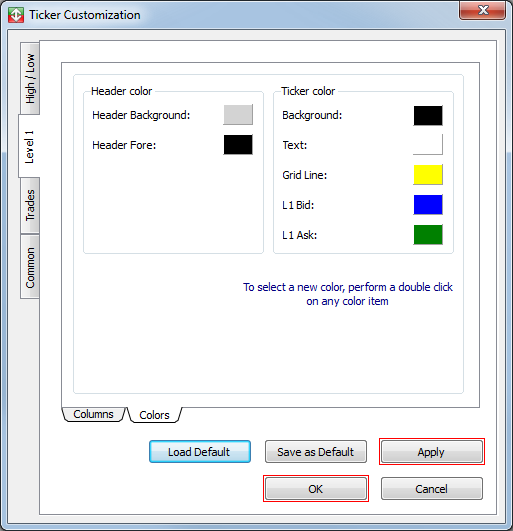
4. The color is set.
Trades
Use the Trades window to filter data, show columns, and set colors for the Ticker window’s trade mode.
- Click the Trades tab to open the Trades window.
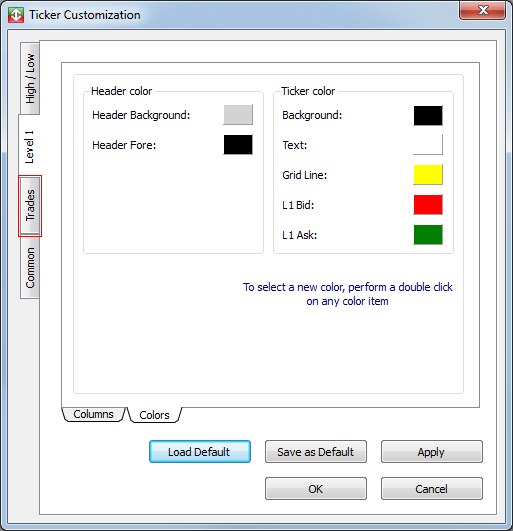
The Trades window contains three sub-tabs: Options, Columns, and Colors.
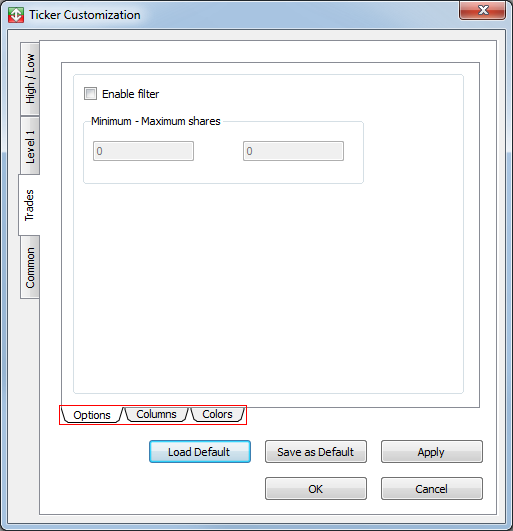
Options
Use the Options window to filter ticker data in trade mode.
1. Click the Options sub-tab.

2. The Options window appears.
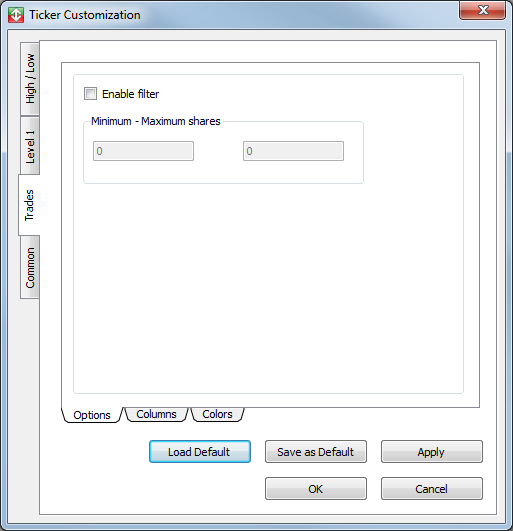
Set a filter
1. Select the Enable filter check box.
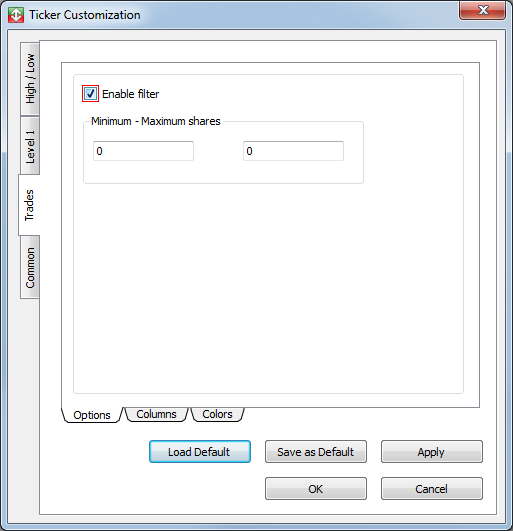
2. Type values in the Minimum and Maximum share size fields, respectively.
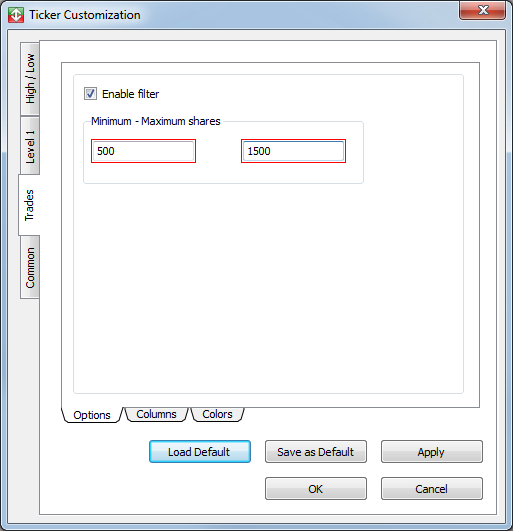
3. Click Apply, and then click OK.
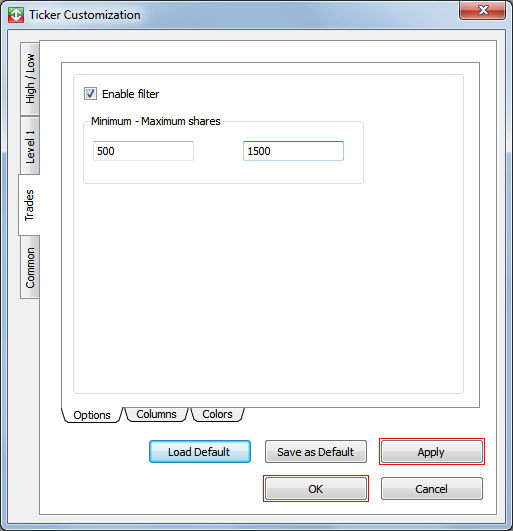
4. The filter is set for data ranging between the Minimum and Maximum share sizes.
Columns
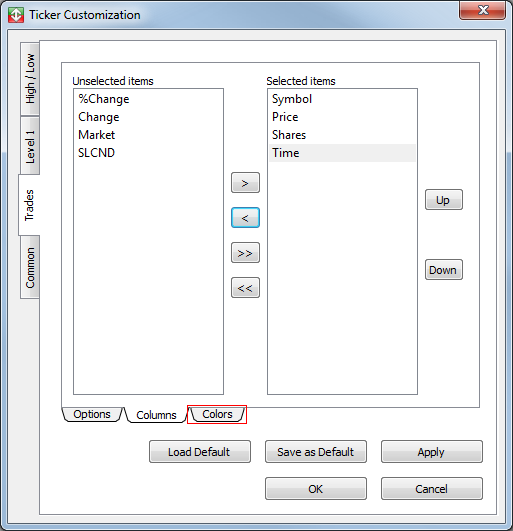
Use the Columns window to show or hide columns in trade mode.
1. Click the Columns sub-tab.
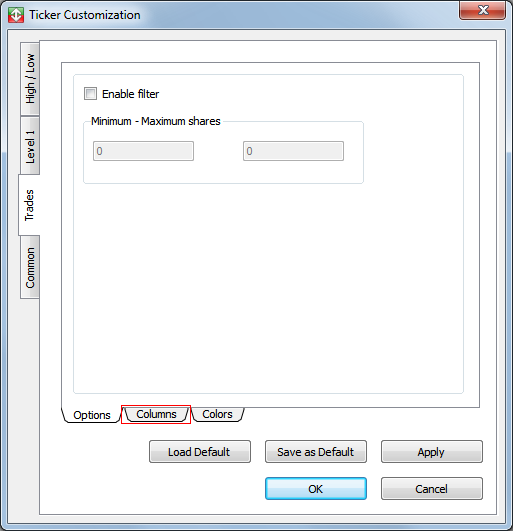
2. The Columns window appears.
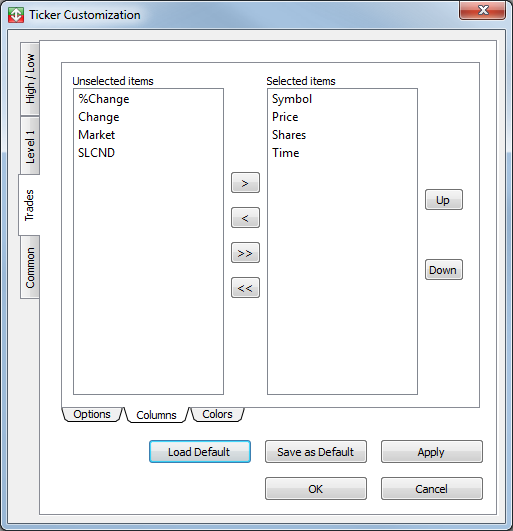
Show a column in trade mode
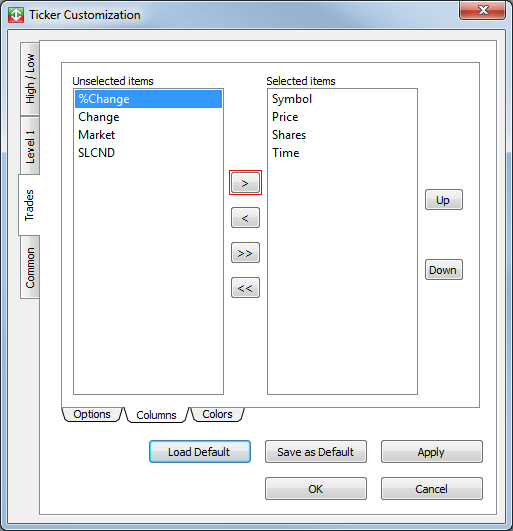
1. Click an item in the Unselected items list.
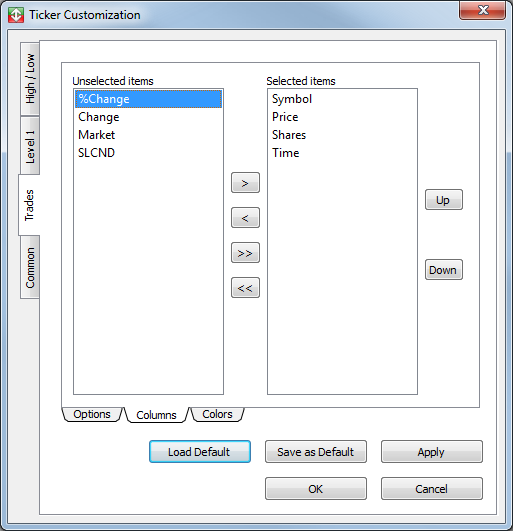
2. Click the right arrow to move the item to the Selected items list.
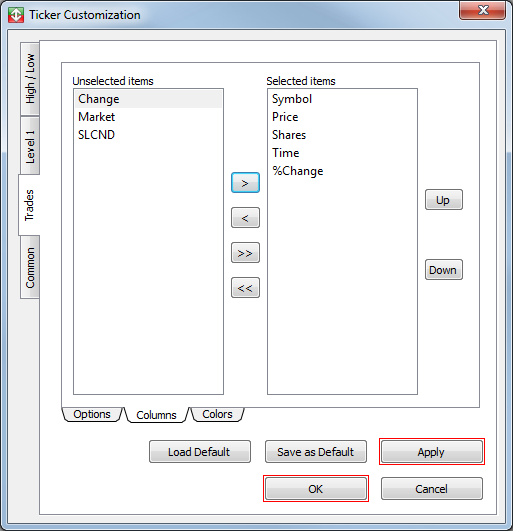
3. Click Apply, and then click OK.
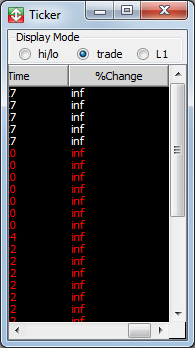
4. The column appears in the Ticker window.
Hide a column from trade mode
1. Click an item in the Selected items list.
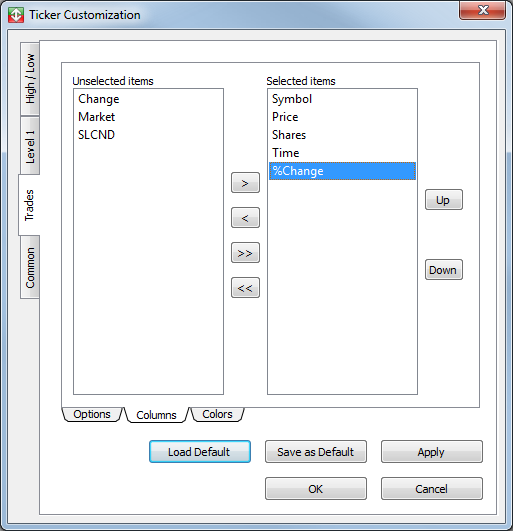
2. Click the left arrow to move the item to the Unselected items list.
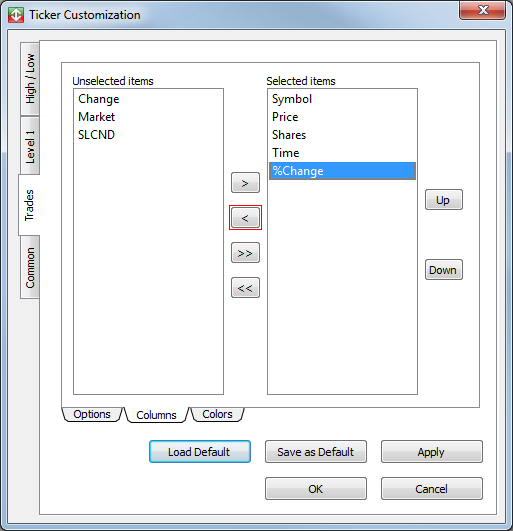
3. Click Apply, and then click OK.

4. The column is hidden from the Ticker window.
Colors
Use the Colors window to set the colors for the header and ticker in trade mode.
1. Click the Colors sub-tab.
2. The Colors window appears.
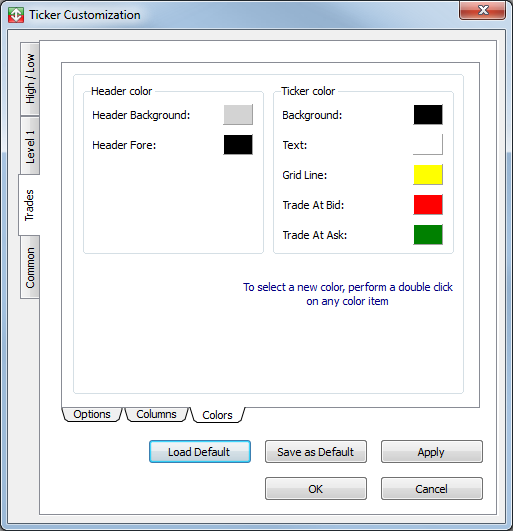
Set a color in trade mode
1. Double-click the color box next to a feature, for example, Trade At Bid under the Ticker color heading.
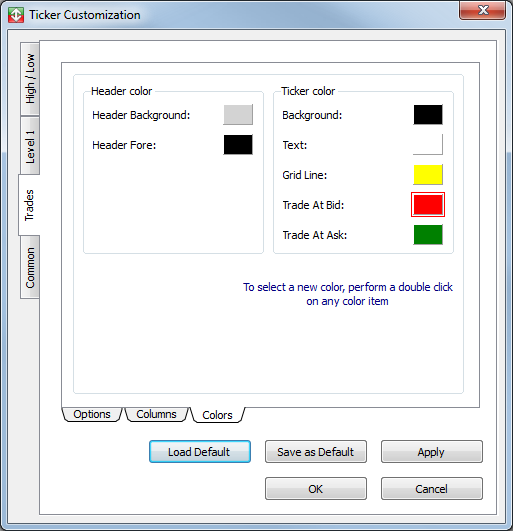
2. The Color dialog window appears. Click a color, and then click OK.
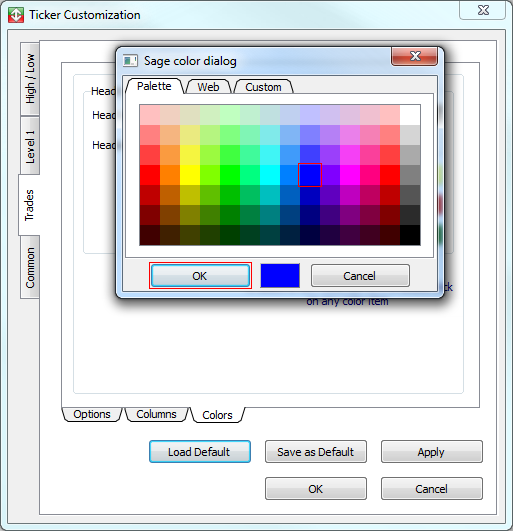
3. In the Color window, click Apply, and then click OK.
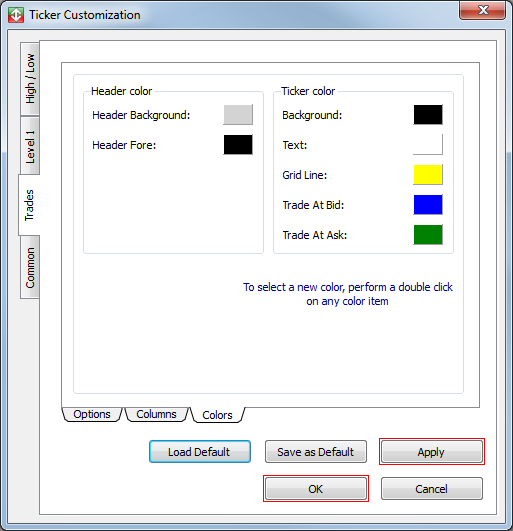
4. The color is set.
Common
Use the Common window to set the common settings for the Ticker window.
- Click the Common tab to open the Common window.
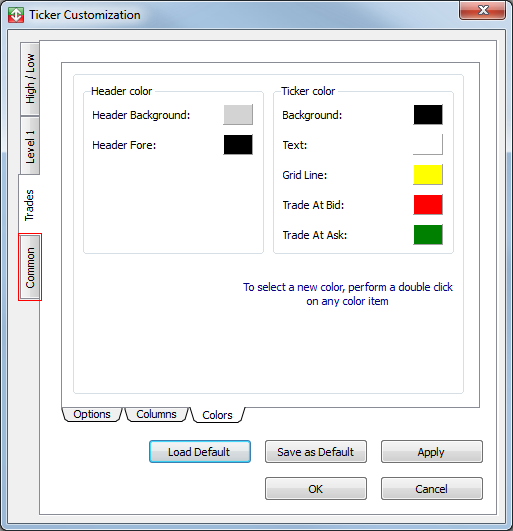
The Common window contains three sub-tabs: Lines/Bars, Font, and Symbol Lists.
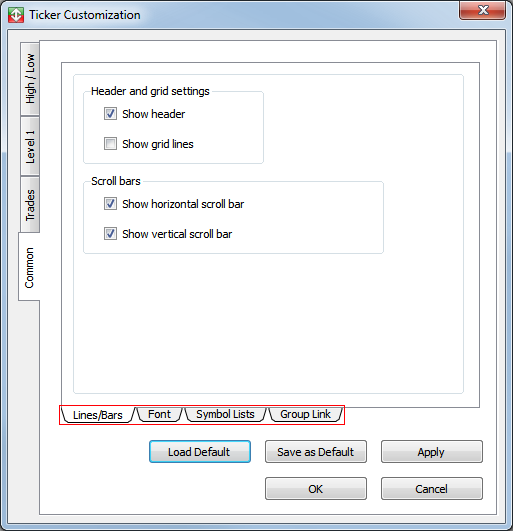
Lines/Bars
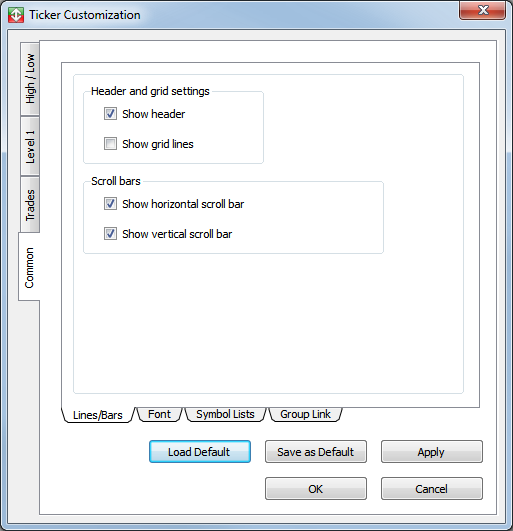
Use the Lines/Bars window to show lines and bars in the Ticker window.
1. Click the Lines/Bars sub-tab.
2. The Lines/Bars window appears.
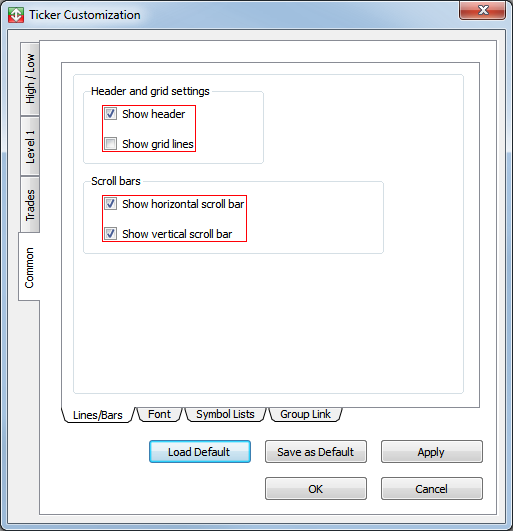
Show lines and bars
- Select or clear the check boxes next to the features to show or hide them from the ticker window.
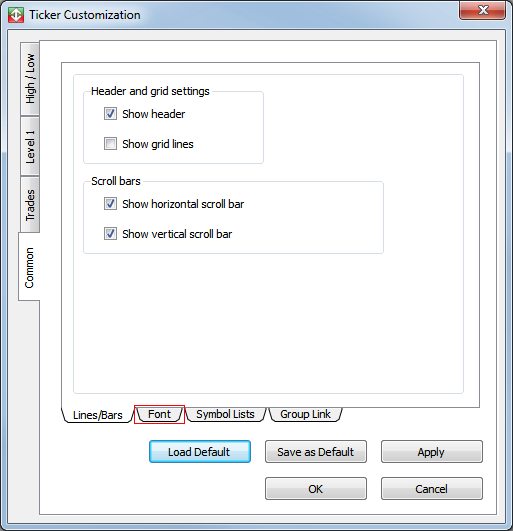
Font
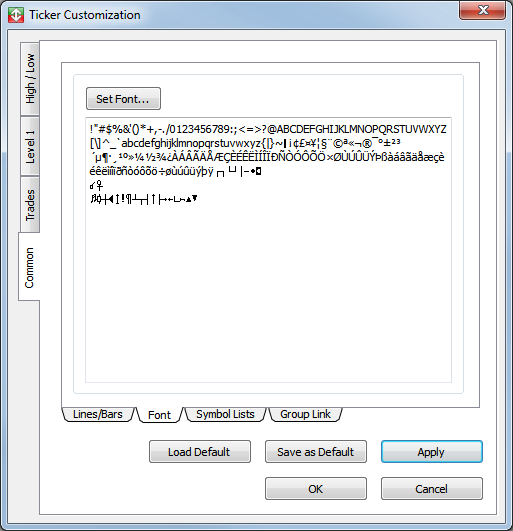
Use the Font window to set the overall font for the Ticker window.
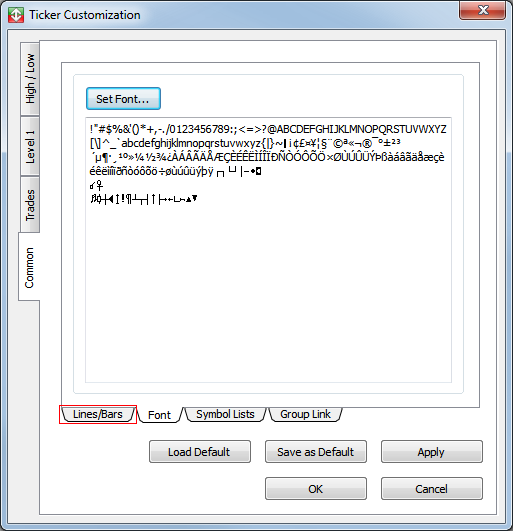
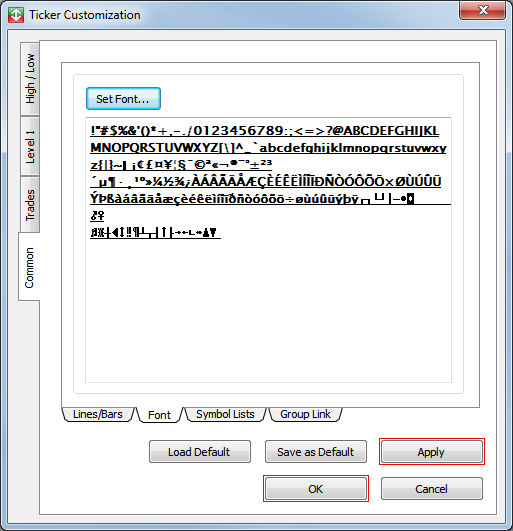
1. Click the Font sub-tab.
2. The Font window appears.
Set a font for the Time of Sales Window
1. Click Set font….
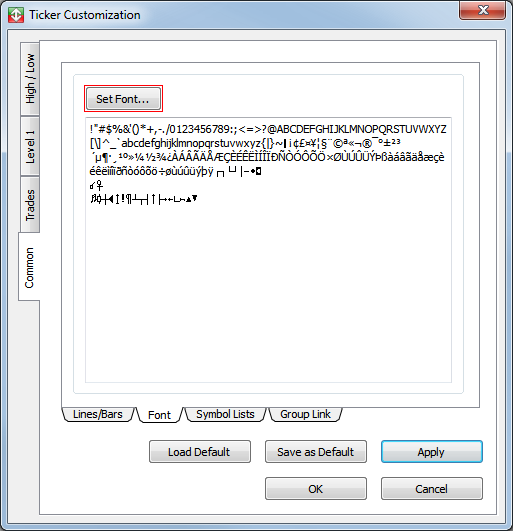
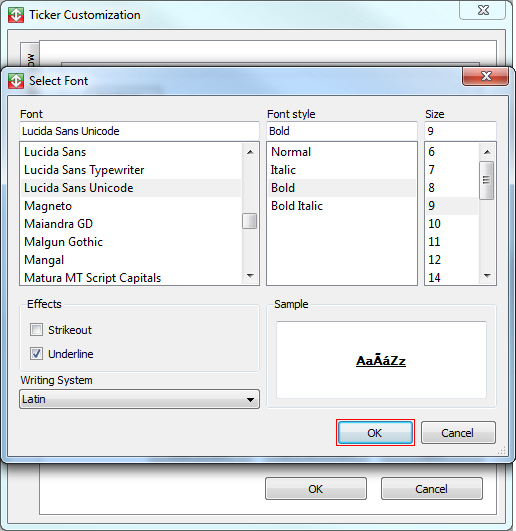
2. The Select Font window appears.
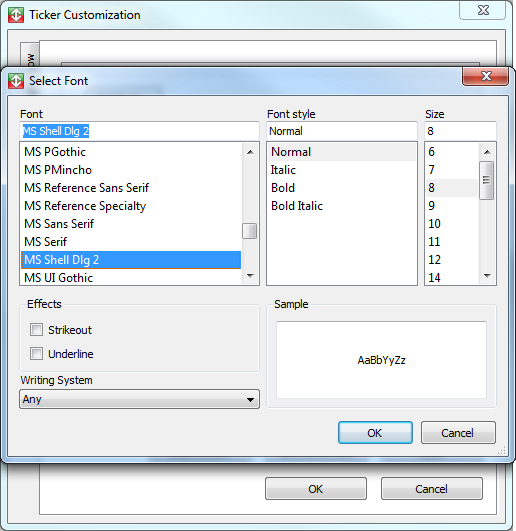
3. Click the font, font style, size, effects, and writing system you want to set.
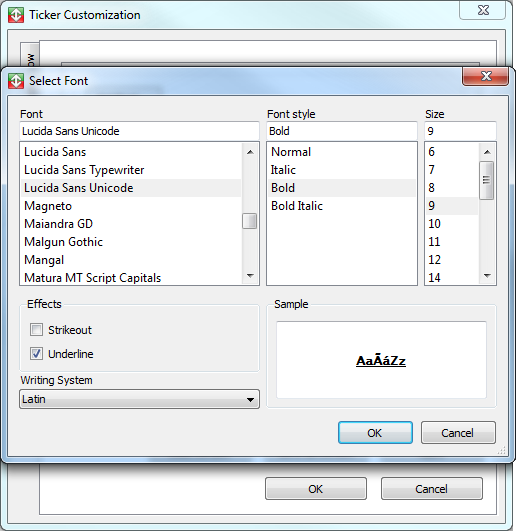
4. Click OK.
5. Click Apply, and then click OK.
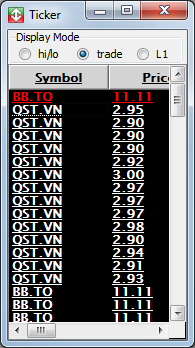
6. The new font appears in the Ticker window.
Symbol Lists
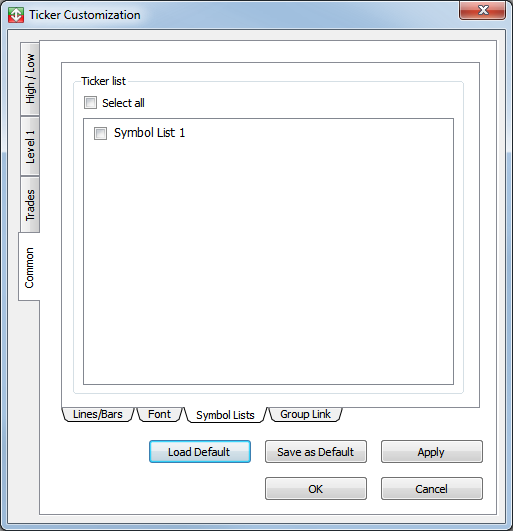
Use the Symbol Lists to show specific symbols.
1. Click the Symbol Lists sub-tab.
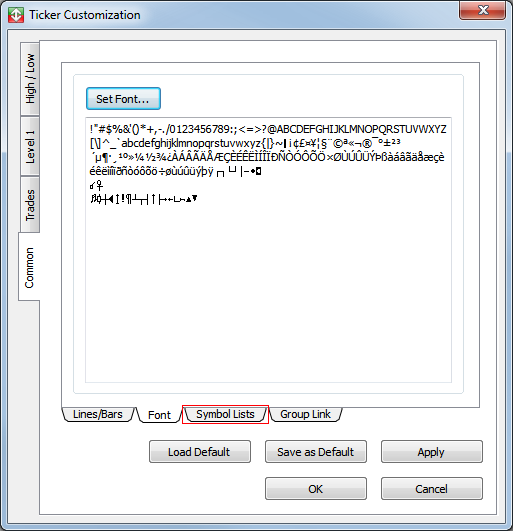
2. The Symbol Lists window appears.
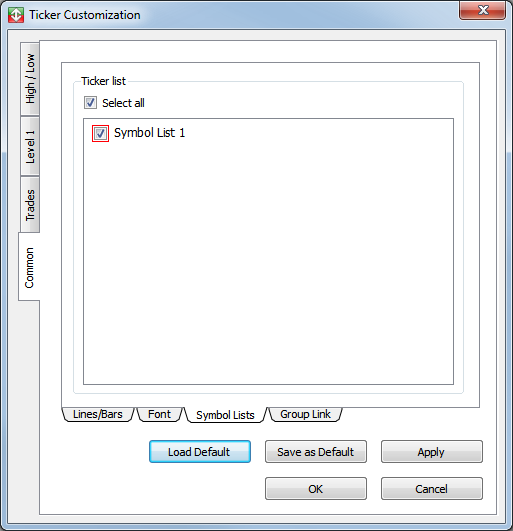
Show a symbol list
- Select or clear the check box next to the symbol list name to show or hide it from the Ticker window.
Note: to view values for symbols in the Ticker window, first set up a symbol list in the SymbolsList Editor.
