This is an old revision of the document!
Table of Contents
PPro8 Chart Window
This work is licensed under a Creative Commons Attribution-NonCommercial-NoDerivs 3.0 Unported License.
Use the PPro8 Chart Window to display charts that can help with trading decisions.
Open a Chart Window
1. On the PPro8 toolbar, click ChartWindow.

2. An empty Chart Window appears.
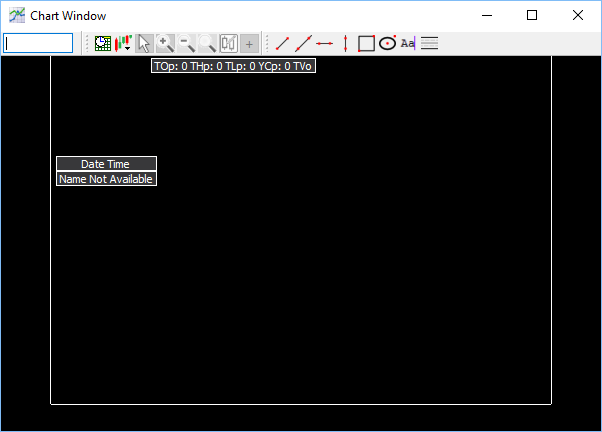
Chart Window components
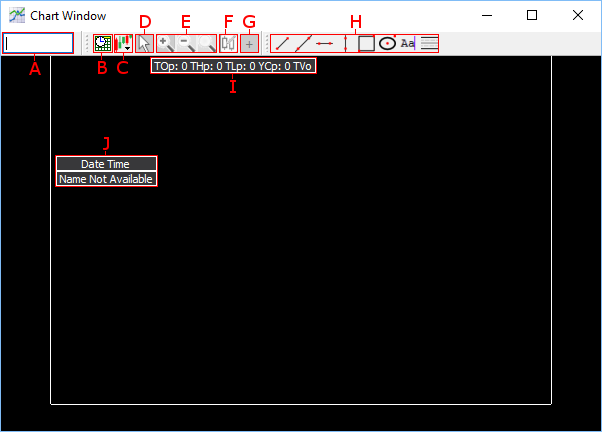
A. Symbol Box: type the symbol (for example, BB), press Tab, click the market extension (for example, TO), and press Enter to load the chart.
B. Time Interval: click to open the Chart Interval window, and type in values to set the time interval.

C. Shape Type: click the option for the type of chart you want to draw, either Candle Stick, OHLC Bar, or Long/Short Line.
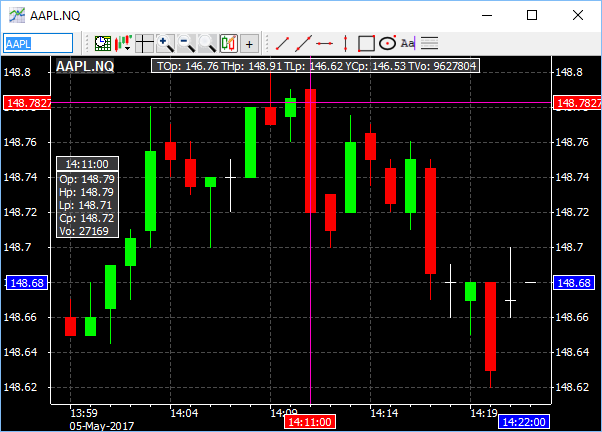
D. Cursor Mode: click either Cross or No Cross to either add or remove a coordinate system to the cursor to help read time and price information.
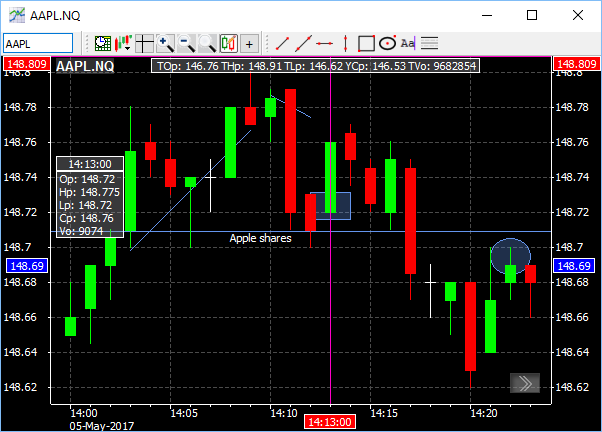
E. OHLC Title Bar: view daily values, including opening price, high price, low price, closing price, and volume.
F. Zoom In/Zoom Out/Zoom Reset: click the appropriate button to zoom in or zoom out and view a specific interval movement.
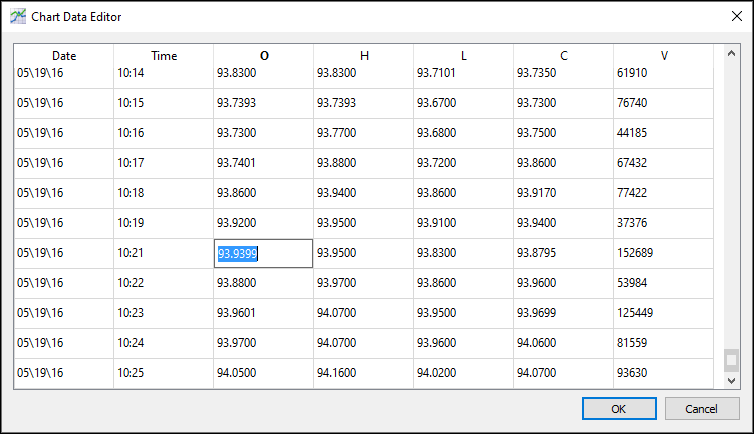
G. Data Editor: manually change the data that displays in the Chart Window. When a bad print appears in the Time of Sales window, it triggers a visible, incorrect change in price or volume in the Chart Window for a specific minute. You can set Cursor Mode to Cross to identify the minute when there is a bar that needs to change. To make this change, open the Data Editor, type the correct value, click OK, and the Chart Window updates.
H. Add Symbol: click to add another symbol.
I. Open/High/Low/Close Info: view the symbol’s Open Price, High Price, Low Price, and Closing Price, as well as Volume, for the trading day.
J. Toolbar Tab: click to show or hide the Main Toolbar, the Drawing Toolbar, or the Status Bar.
Drawing Toolbar
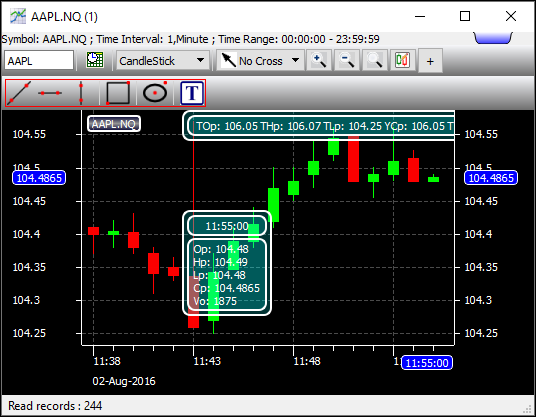
Use the Drawing Toolbar to add lines, shapes, or text to the Chart Window.
Add lines, shapes, and text to Chart Window
1. On the Drawing Toolbar, click Draw Line.
2. Click a starting point for the line in the Chart Window, and then click an end point.
3. The line is drawn.
4. On the Drawing Toolbar, click Draw Polygon.
5. Click a starting point for the shape in the Chart Window, and then click an end point.
6. The shape is drawn.
7. On the Drawing Toolbar, click Insert Text.
8. Click anywhere in the Chart Window.
9. Type the text you want to add.
10. The text is added.
11. To remove a line, shape, or text, right-click it, and then click Remove.
Send order from Chart Window
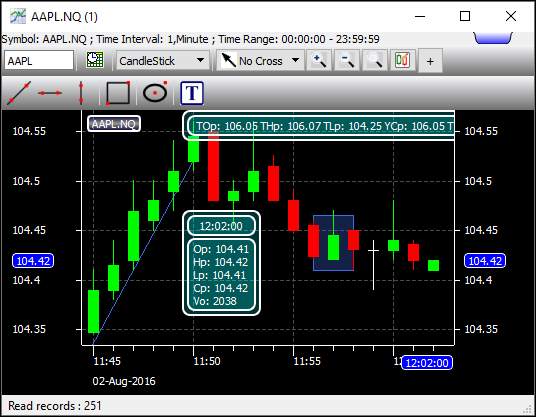
You can send orders when Chart Window is open and on Top. To use this function, enable the Order Edit Box feature in Customization, and then follow these steps.
1. Set up keyboard shortcuts with Keyboard Setup.
2. Open a new Chart Window.
3. Type the symbol and market extension, and then press Enter.
4. Type a keyboard shortcut.
5. The order edit box appears.
6. Edit the order (type values in the Limit Price and Shares fields as needed), and then press Enter to execute.
7. The order is sent from the Chart Window.
Chart Window Customization
To make changes to the Chart Window settings, right-click anywhere in the Chart Window to open the Chart Window Customization window. This window displays three main tabs on the left: Display, Indicators, and Multiple Symbols.
Note: a symbol must be loaded in the Chart Window before you can open Customization.
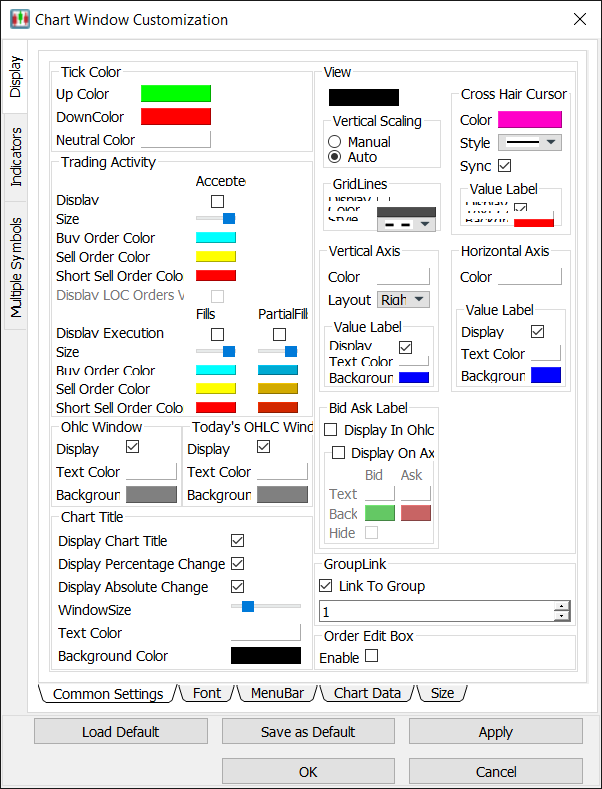
Display
Use the Display window to adjust the display settings for the Chart Window.
- Click the Display tab to open the Display window.
The Display window contains four sub-tabs: Common Settings, Font, Menu Bars, and Chart Data.
Common Settings
Use the Common Settings window to adjust color and layout settings for the Chart Window.
1. Click the Common Settings sub-tab in the Display window.
2. The Common Settings window appears.
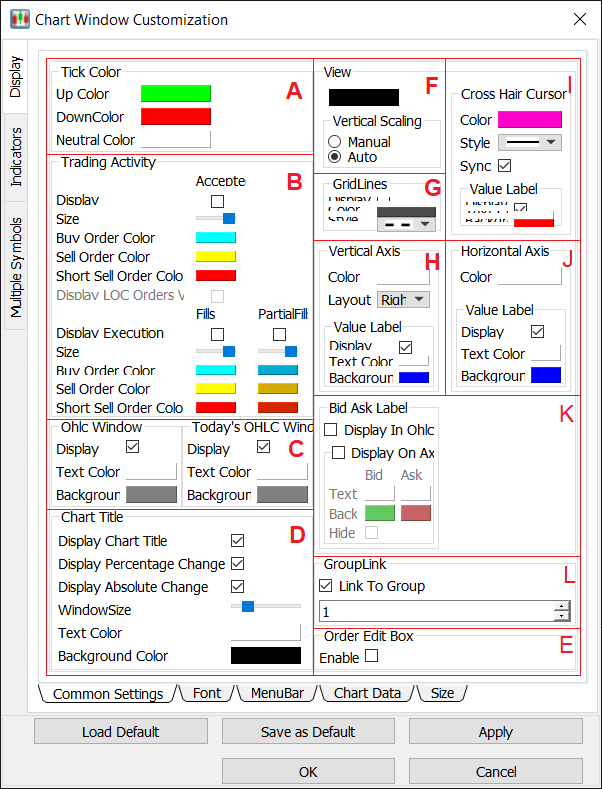
A. Set tick color
1. In the Common Settings window, double-click the color box for either of the three options (Up Color, Down Color, or Neutral Color).
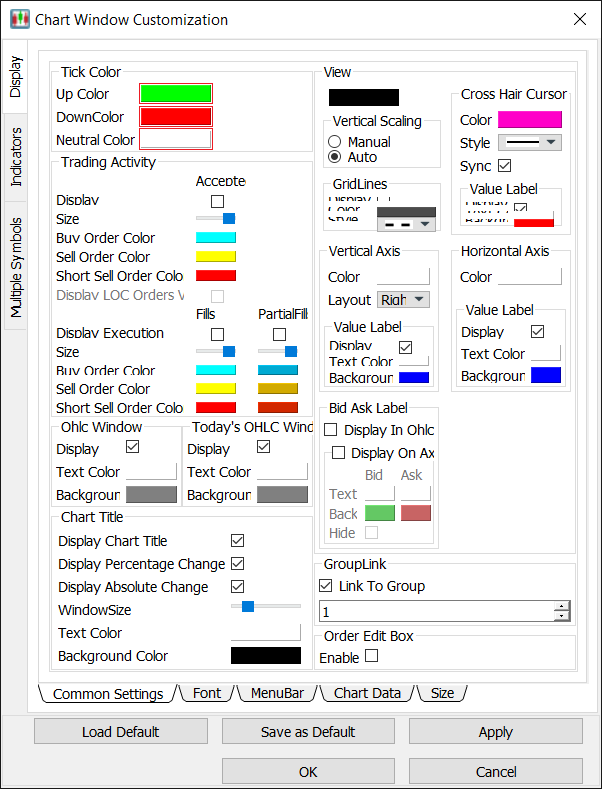
2. The Color Selector window appears. Click a color, and then click OK.
3. In the Customization window, click OK.
4. The tick color is set.
B. Adjust trading activity settings
1. In the Common Settings window, select or clear the check boxes for the Display Accepted Order and the Display Execution options to hide or display them.
2. Double-click the color box for either of the three color options (Buy Order Color, Sell Order Color, or Short Sell Order Color).
3. The Color Selector window appears. Click a color, and then click OK.
4. In the Customization window, click OK.
5. The trading activity options are set.
C. Display or hide the OHLC Window
- Select or clear the check box for the Ohlc Window display option to show or hide the OHLC Window.
D. Enable or disables the Order Edit Box
- Select or clear the check box for the Enable option to enable or disable the Order Edit Box feature in the Chart Window.
E. Link Chart Window to a group
- If this option is selected, the Chart Window is grouped by number with other tools, such as the Stock Window and the TOS Window. Other windows in the window group of the same number change their symbol to correspond to the symbol in the Chart Window.
Adjust View settings
F. Set Chart Window background color
1. In the View section, double-click the color box for Background color.
2. The Color Selector window appears. Click a color, and then click OK.
3. In the Customization window, click OK.
4. The background color is set.
- To hide or display indicator labels on the chart, clear or select the Display Chart Title check box.
G. Set Vertical Scaling
1. In the Vertical Scaling section, click the Manual or Auto option to set vertical scaling to manual or automatic.
2. In the Customization window, click OK.
3. The vertical scaling is set. When vertical scaling is set to manual, clicking and dragging the vertical axis up or down changes the scale.
H. Set Grid Lines
1. In the GridLines section, select or clear the Display check box to show or hide grid lines.
2. Double-click the color box, click a color, and then click OK.
3. Click the grid style you want to set in the Style menu.
4. In the Customization window, click OK.
5. The grid lines are set.
I. Set Vertical Axis
1. In the Vertical Axis section, double-click the color box, click a color, and then click OK.
2. In the Layout menu, click Left, Right, or Both.
3. In the Value Label subsection,
- select or clear the Display check box to show or hide the value label;
- double-click the color box for Text Color, click a color, and then click OK;
- double-click the color box for Background Color, click a color, and then click OK.
4. In the Customization window, click OK.
5. The vertical axis is set.
J. Set Cross Hair Cursor
1. In the Cross Hair Cursor section,
- double-click the Color box, click a color, and then click OK;
- click the cross hair cursor style you want to set in the Style menu;
- select or clear the Sync on View check box to sync or unsync.
2. In the Value Label subsection,
- select or clear the Display check box to show or hide the value label;
- double-click the color box for Text Color, click a color, and then click OK;
- double-click the color box for Background Color, click a color, and then click OK.
3. In the Customization window, click OK.
4. The cross hair cursor is set.
K. Set Horizontal Axis
1. In the Horizontal Axis section, double-click the color box, click a color, and then click OK.
2. In the Value Label subsection,
- select or clear the Display check box to show or hide the value label;
- double-click the color box for Text Color, click a color, and then click OK;
- double-click the color box for Background Color, click a color, and then click OK.
3. In the Customization window, click OK.
4. The horizontal axis is set.
Font
Use the Font window to set the overall font for the Chart Window.
1. Click the Font sub-tab.
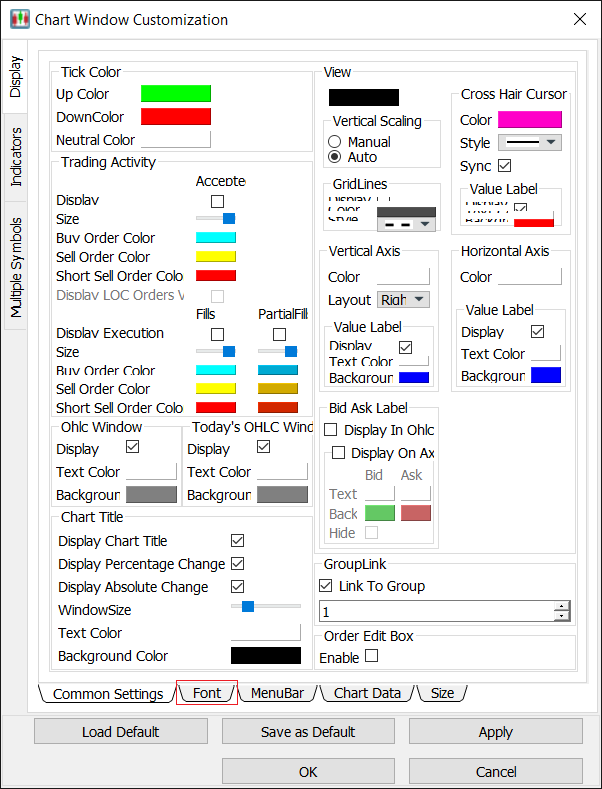
2. The Font window appears.
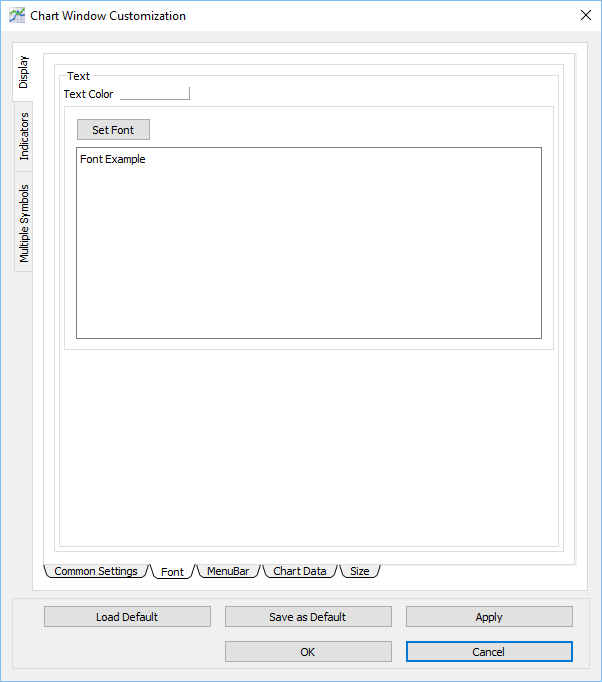
Set a font for the Chart Window
1. In the Font window, double-click the color box for Text Color, click a color, and then click OK.
2. Click Set Font….
3. The Select Font window appears.
4. Click the font, font style, size, effects, and writing system you want to set.
5. Click OK.
6. In the Customization window, click OK.
7. The font is set.
Menu Bar
Use the Menu Bar window to show or hide icons from the menu bar in the Chart Window.
1. Click the Menu Bar sub-tab.
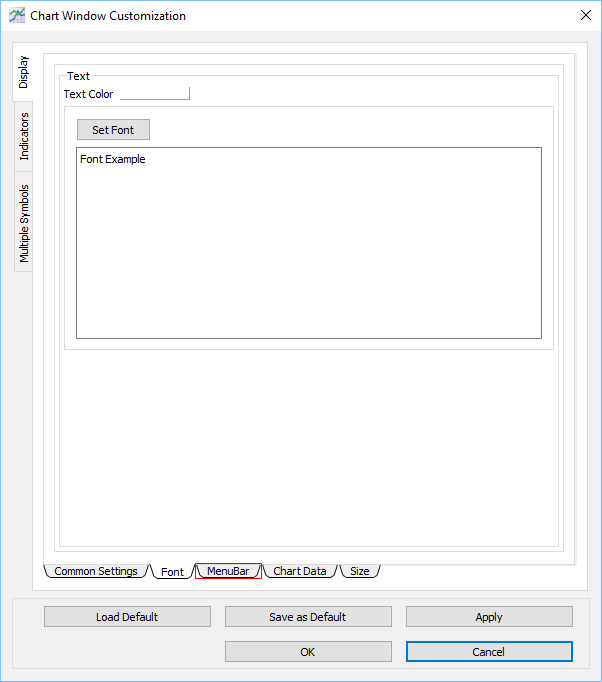
2. The Menu Bar window appears.
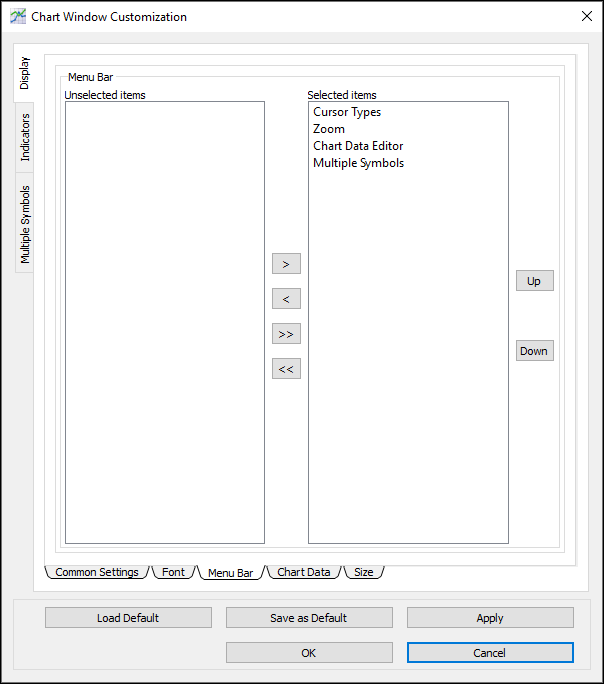
Show an item in the Chart Window
1. In the Menu Bar window, click an item in the Unselected items window.
2. Click the right arrow to move the item to the Selected items list.
3. In the Customization window, click OK.
4. The item appears in the Chart Window.
Hide an item from the Chart Window
1. In the Menu Bar window, click an item in the Selected items list.
2. Click the left arrow to move the item to the Unselected items list.
3. In the Customization window, click OK.
4. The item is hidden from the Chart Window.
Chart Data
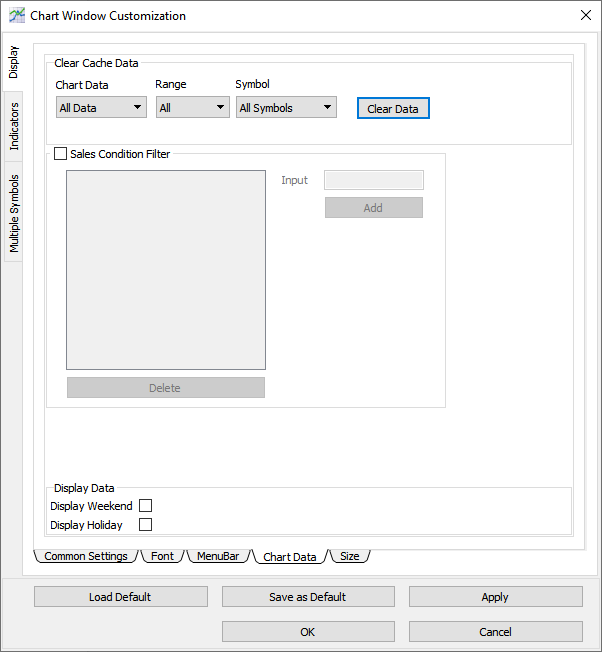
Use the Chart Data window to clear data from the Chart Window, and to hide or display weekend and holiday data.
1. Click the Chart Data sub-tab.
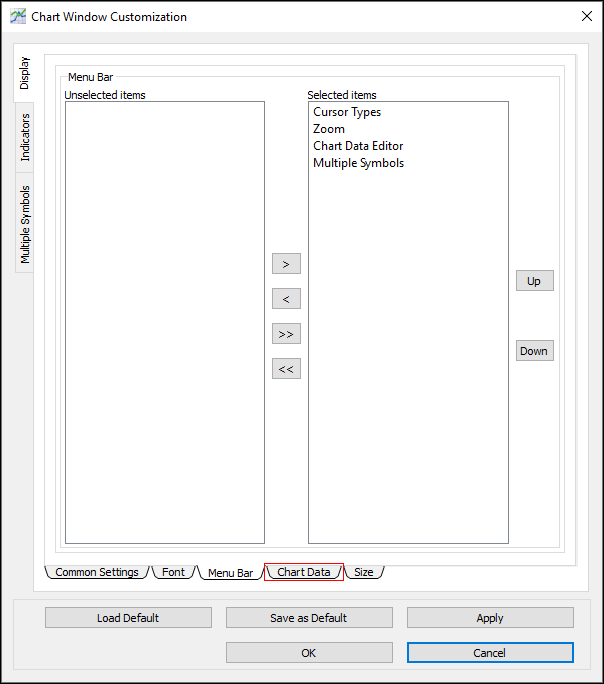
2. The Chart Data window appears.
Clear cache data
1. In the Chart Data window, click the Chart Data menu, and then click an option (either All Data, Minute Data, or Day Data).
2. Click the Range menu, and then click All or Today.
3. Click the Symbol menu, and then click All Symbols or Current Symbol.
4. Click Clear Data.
5. The cache data is cleared.
Show or hide weekend and holiday data
1. In the Chart Data window, select or clear the checkboxes for the Display Weekend and the Display Holiday options to show or hide weekend and holiday data in the Chart Window.
2. In the Customization window, click OK.
3. The chart data is updated.
Indicators
Use the Indicators window to adjust the indicator settings for the Chart Window.
- Click the Indicators tab to open the Indicators window.
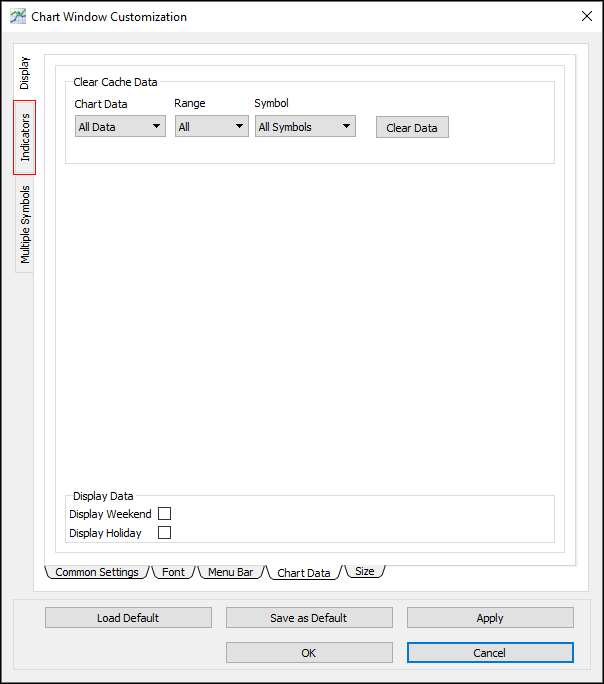
The Indicators window contains one sub-tab: Technical Indicators.
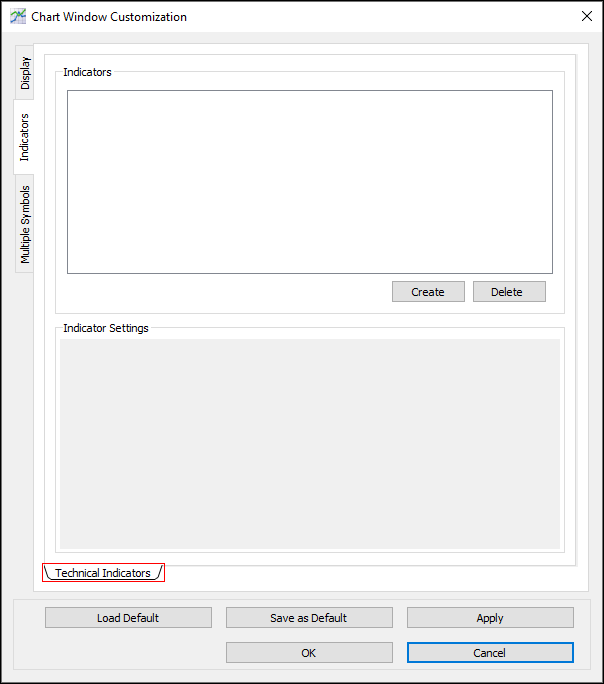
Technical Indicators
Use the Technical Indicators window to create, adjust, or delete technical indicators for the Chart Window.
Create a technical indicator
1. In the Technical Indicators window, click Create.
2. The Create New Indicator window appears.
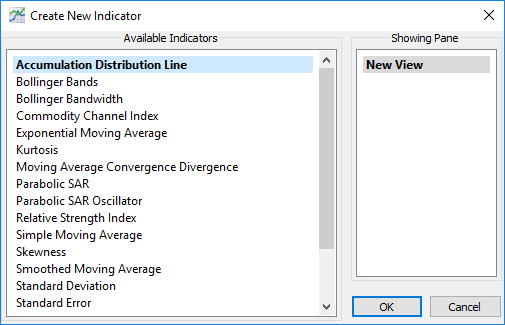
3. Click an indicator in the Available Indicators list.
4. Click OK.
5. The indicator appears in the Indicators section.
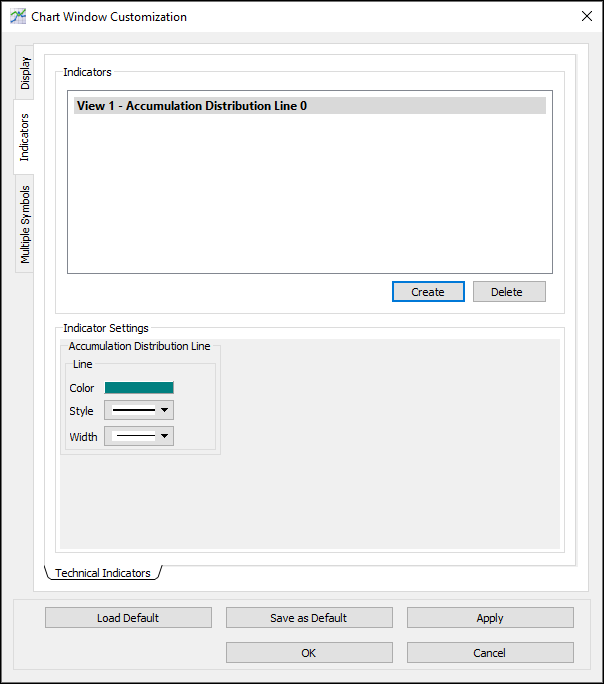
5. In the Indicator Settings section, type or click to adjust the indicator’s settings.
6. Click OK.
7. The indicator appears in the Chart Window.
Multiple Symbols
Use the Multiple Symbols window to add, remove, and compare multiple symbols from the Chart Window.
- Click the Multiple Symbols tab to open the Multiple Symbols window.
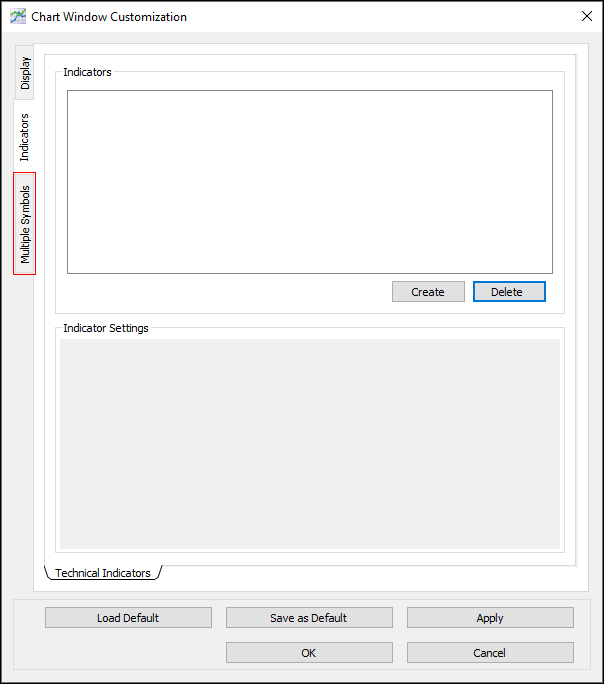
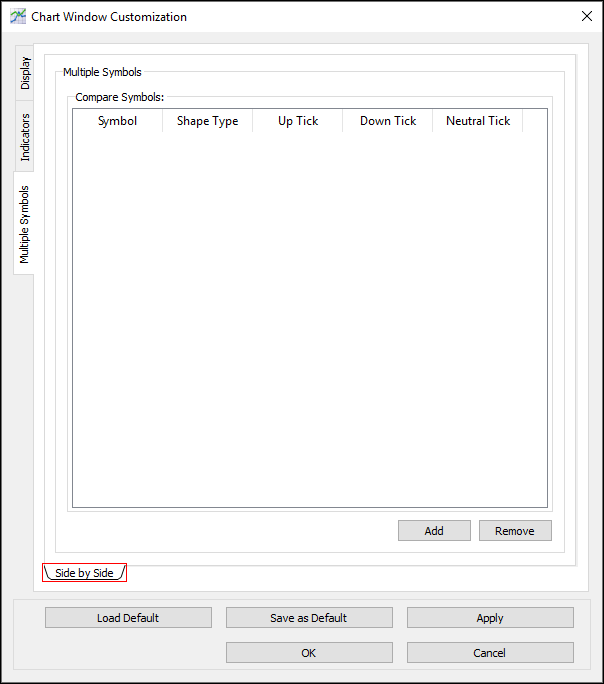
The Multiple Symbols window contains one sub-tab: Side by Side.
Side by Side
Use the Side by Side window to compare symbols, side by side, in the Chart Window.
Add a symbol for comparison
1. In the Side by Side window, click Add.
2. A row appears in the Compare Symbols table.
3. Double-click each cell in the row and type or click the symbol, shape type, up tick color, down tick color, and neutral tick color you want to set.
4. Click OK.
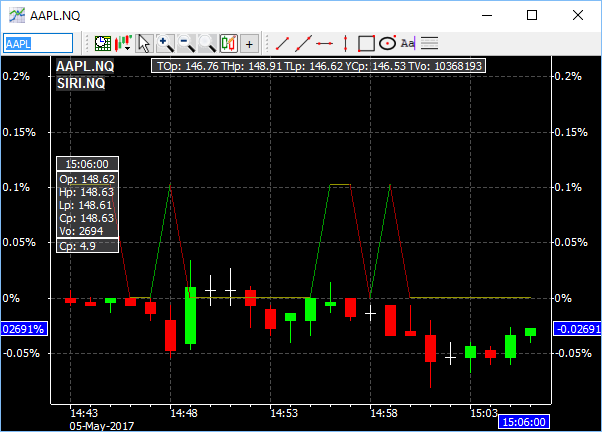
5. The symbol is added to the Chart Window for comparison.
Delete a symbol from comparison
1. In the Multiple Symbols window, click the row for the symbol you want to delete.
2. Click Remove.
3. Click OK.
4. The symbol is deleted from comparison in the Chart Window.
OHLC
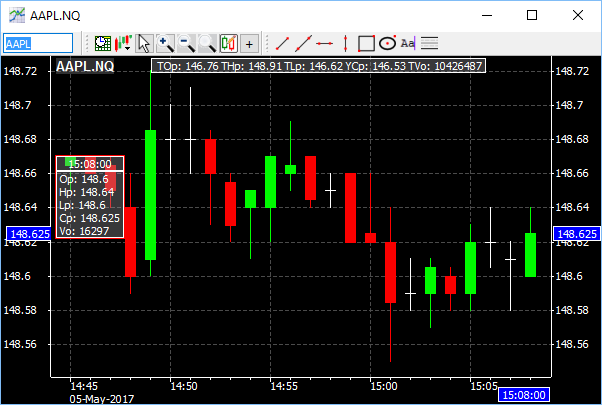
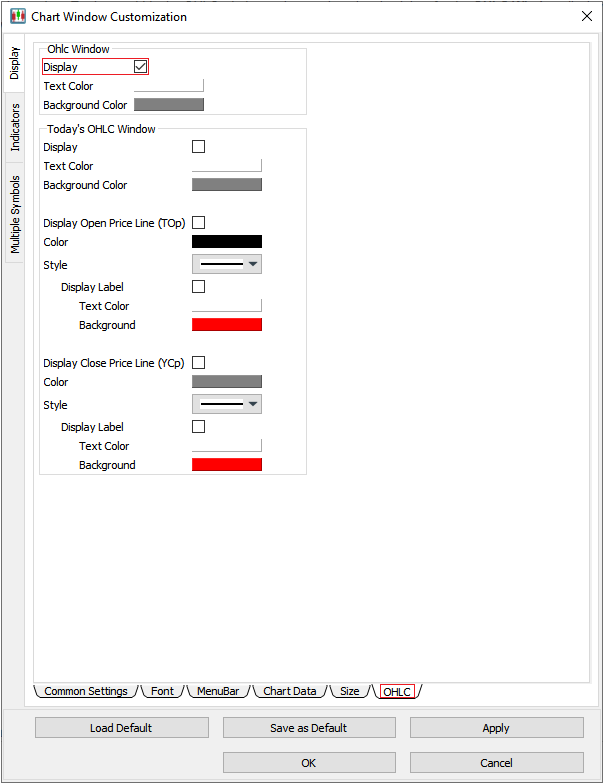
Use the OHLC window to show OHLC values for daily and time-specific values. The OHLC title bar shows daily values, and the OHLC window shows data points. To show or hide the OHLC window, select or clear the check box for the OHLC Window display option in Chart Window Customization: Display: Common Settings.
OHLC title bar
Use the OHLC title bar to view daily values, including:
- TOp = Today’s Opening price
- THp = Today’s High price
- TLp = Today’s Low price
- YCp = Yesterday’s Closing price
- TVo = Today’s Volume
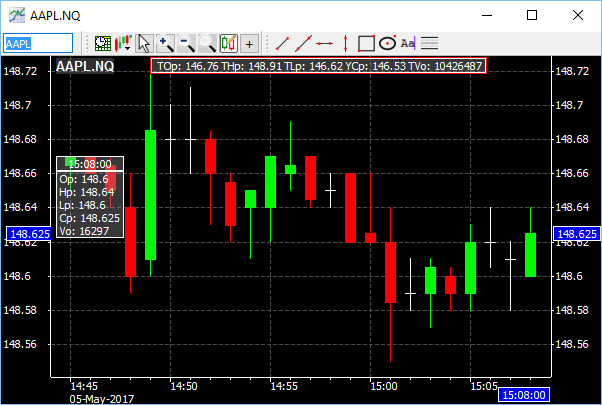
OHLC window
Use the OHLC window to view the last data point (candle) values, or any data point highlighted by the crosshair, including:
- Timestamp
- Op = Opening price
- Hp = High price
- Lp = Low price
- Cp = Closing price
- Vo = Volume
