Table of Contents
PPro8 Time of Sales
The PPro8 Time of Sales (TOS) window displays an instrument's executions.
Open a new Time of Sales window
1. On the PPro8 toolbar, click TimeOfSale.

2. A Time of Sales window appears.
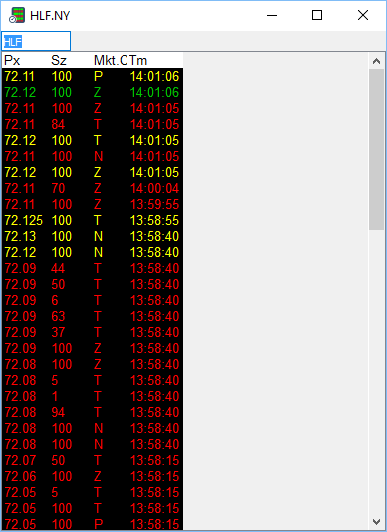
View TOS data in the Time of Sales window
1. Type the symbol in the field at the top left of the Time of Sales window (for example, BB).
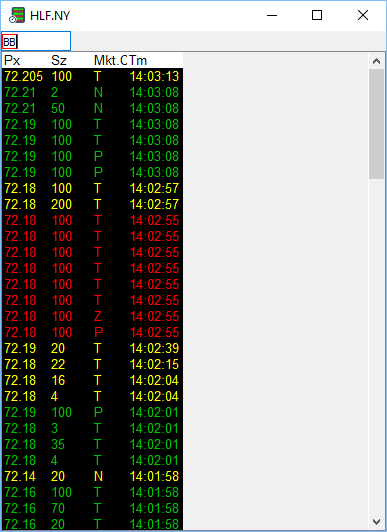
2. Press Tab.
3. Type or click the symbol’s market extension (for example, TO).
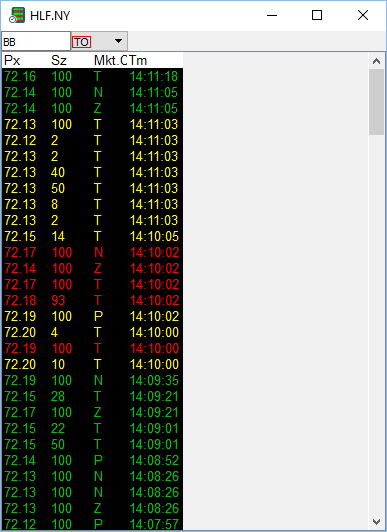
4. Press Enter.
5. The Time of Sales window populates with data about the symbol.
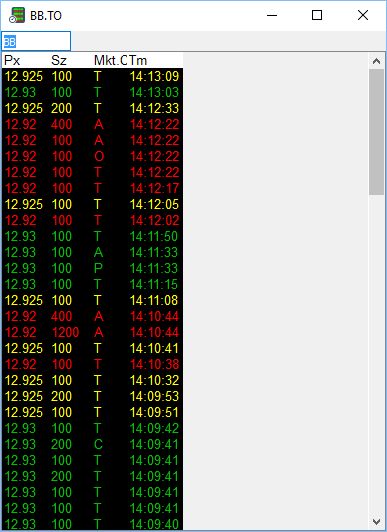
The TOS window displays data in the following fields by default:
- Px (Price): the price at which the trade occurred (denominated in local currency).
- Sz (Size): the number of shares or contracts traded.
- Mkt. Ctr. (Market Center): the exchange or ATS where the trade was executed.
- Tm (Time): the time when the trade occurred.
If added in Customization, the TOS window also displays data in the following fields:
- Tk (Tick): the price up/down/neutral:
- U = Uptick
- D = Downtick
- N = Neutral
- SbMkt (Submarket ID): the ID of the submarket, if any.
- Sl.Cond. (Sale Condition): the condition of the sale.
Add a symbol to an existing symbol list
You can use Time of Sales to add a currently registered symbol to an existing symbol list. This new feature integrates seamlessly with the Symbol List Editor tool, as well as Stock Window, Chart Window, and Summary.
1. Right-click anywhere in the Time of Sales to open the context menu.

2. Point to the Add Symbol to Symbol List menu item.

3. The Currently Selected Symbol List view appears. Click [Select A List] to choose the symbol list where you want to add the current symbol, and then click the Add Symbol button.
4. The symbol is added to the symbol list.
5. To remove a symbol from the list, you will need to open the Symbol List Editor tool and delete it there. For more information, you can read the Symbol List Editor manual.
Time of Sales Window Customization
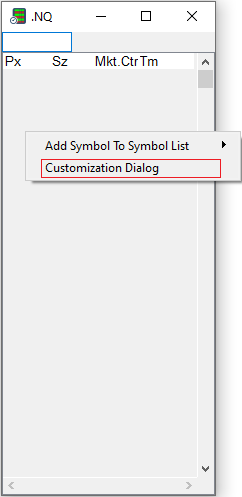
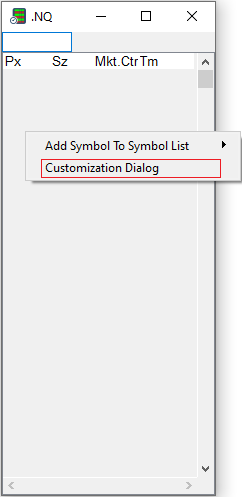
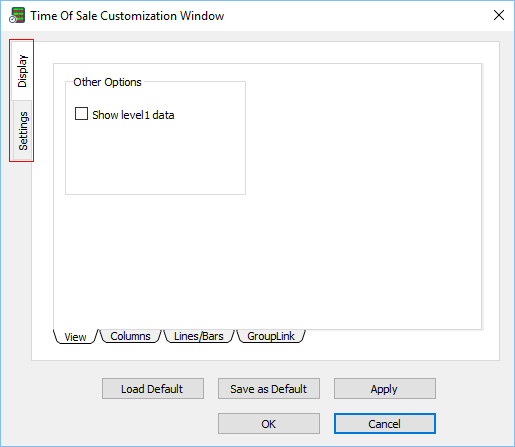
To make changes to the Time of Sales window settings, right-click anywhere in the Time of Sales, and then click the Customization Dialog menu item to open the Time of Sale Customization Window. This window displays two main tabs on the left: Display and Settings.
Always on Top
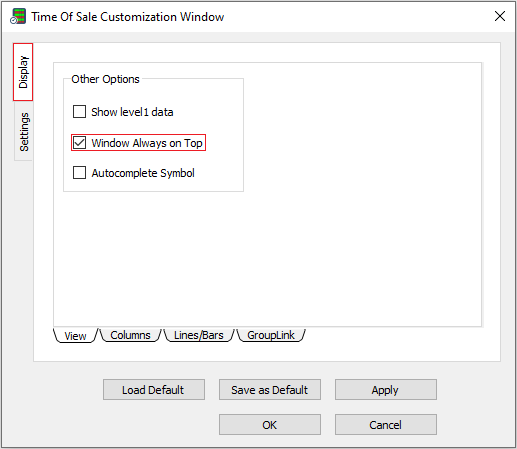
This feature will lock the Time of Sales Window at the highest priority of your screen, and as a result will not allow any other element to overlay above the Time of Sales Window.
1. Right click on the Time of Sales window, and select “Customization Dialog.”
2. In the Display tab, select “Window Always on Top,” ensuring the checkmark is visible.
3. Press “Apply,” then press “OK.”
Autocomplete
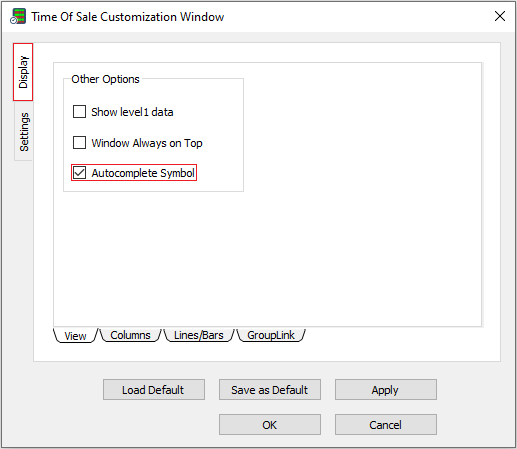
This feature allows PPro8 to provide a list of available symbols starting with a certain string pattern after you have entered at least one character into the Time of Sales Window.
1. Right click on the Time of Sales window, and select “Customization Dialog.”
2. In the Display tab, select “Autocomplete Symbol,” ensuring the checkmark is visible.
3. Press “Apply,” then press “OK.”
Display
Use the Display window to set the display settings for the Time of Sales window.
- Click the Display tab to open the Display window.
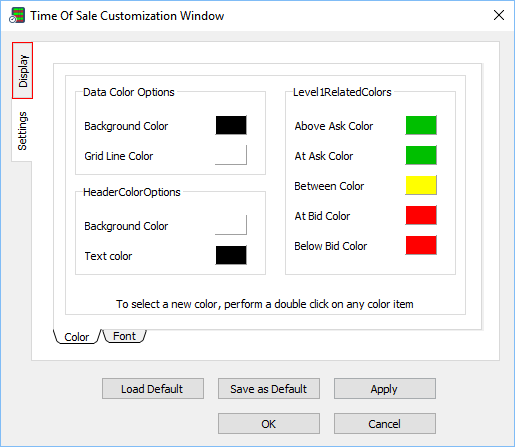
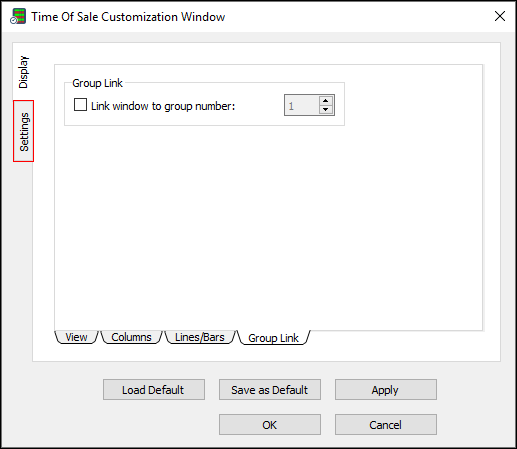
The Display window contains four sub-tabs: View, Columns, Lines/Bars, and Group Link.
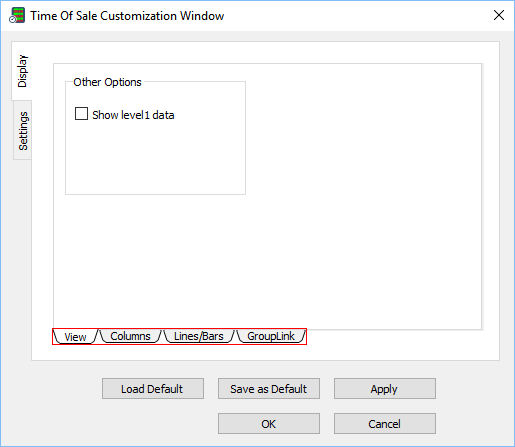
View
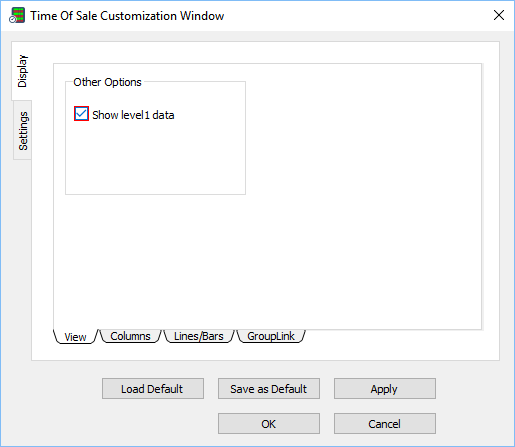
Use the View window to set Other Options.
- Select the Show level1 data check box to show Level 1 (Lv1) quotes in the Time of Sales window.
Columns
Use the Columns window to show or hide columns.
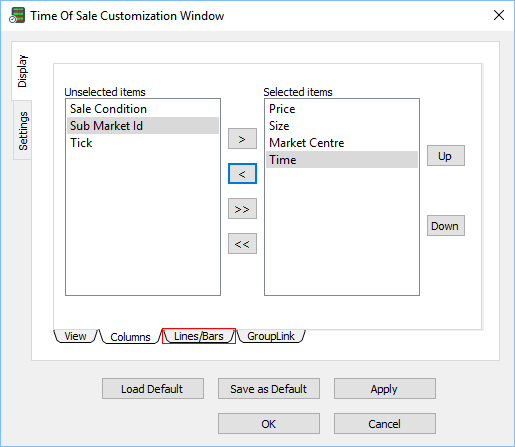
1. Click the Columns sub-tab in the Display Window.
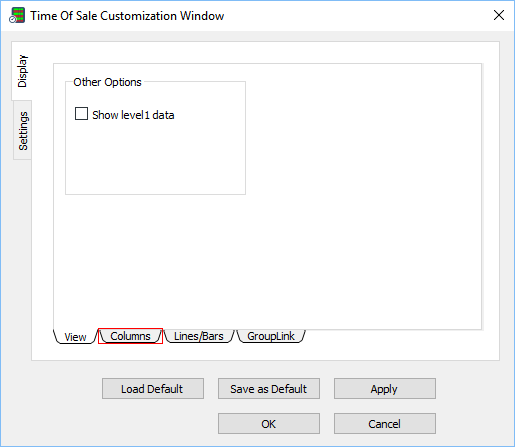
2. The Columns window appears.
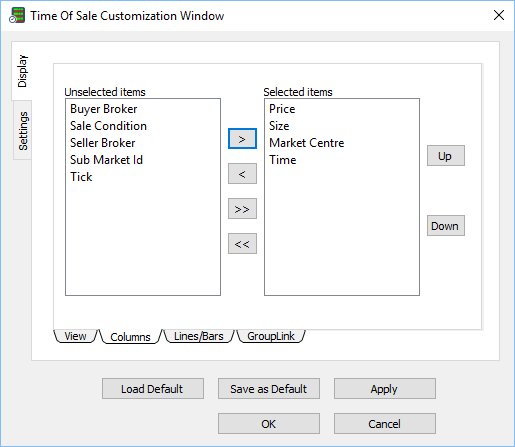
Show a column in the Time of Sales window
1. In the Columns window, click an item in the Unselected items list.
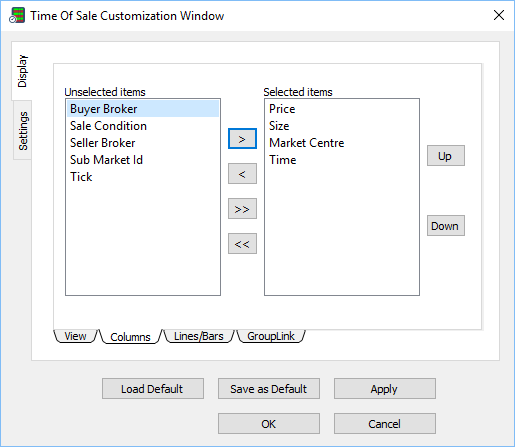
2. Click the right arrow ( > ) to move the item to the Selected items list.
3. Click OK.
4. The item appears in the Time of Sales Window.
Hide an item from the Time of Sales Window
1. In the Columns window, click an item in the Selected items list.
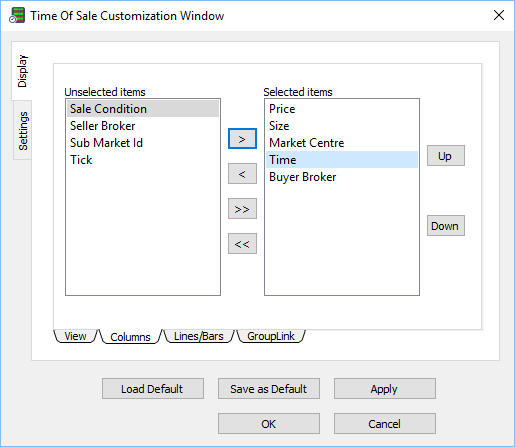
2. Click the left arrow ( < ) to move the item to the Unselected items list.
3. Click OK.
4. The item is hidden from the Time of Sales window.
Lines/Bars
Use the Lines/Bars window to show or hide the header, grid lines, scroll bars, and time (to the second).
1. Click the Lines/Bars sub-tab in the Display window.
2. The Lines/Bars window appears.
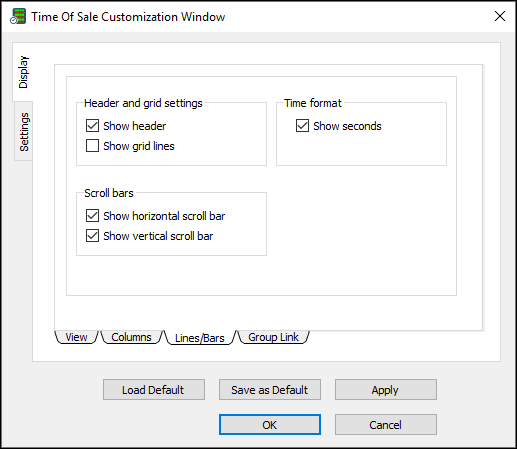
Select or clear the check boxes under the Header and Grid Settings, Time format, and Scroll Bars headings to show or hide the various features.
Group Link
Use the Group Link window to link the Time of Sales window to other tools, such as the Stock Window and the Chart Window.
1. Click the Group Link sub-tab in the Display window.
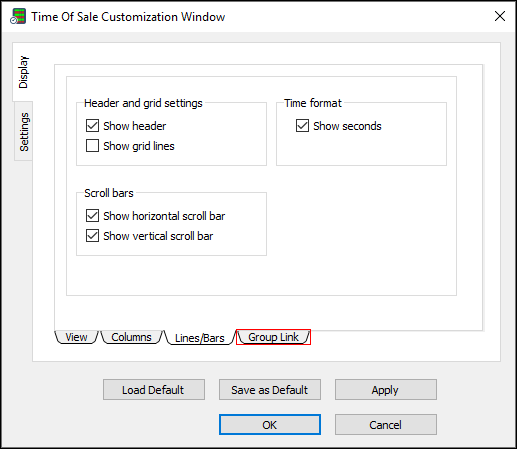
2. The Group Link window appears.
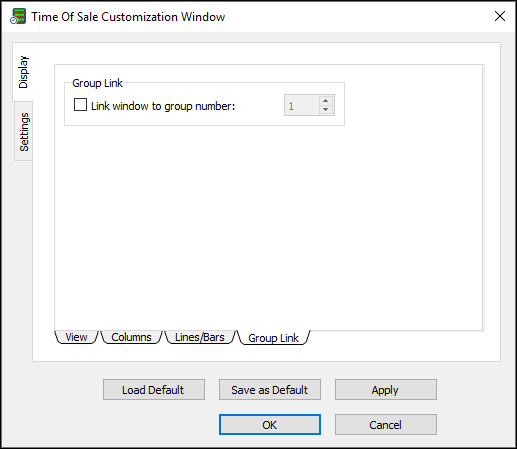
Link the Time of Sales window to other windows
1. Select the Link window to group number check box.
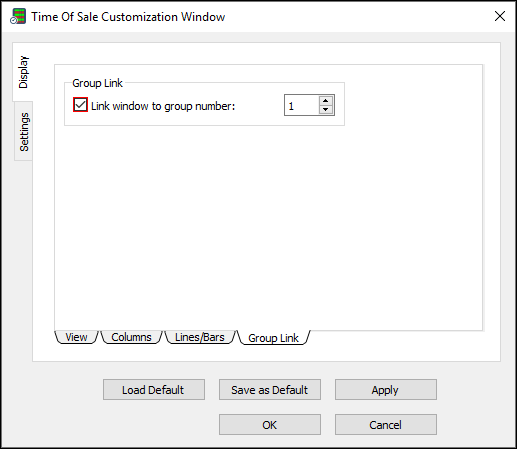
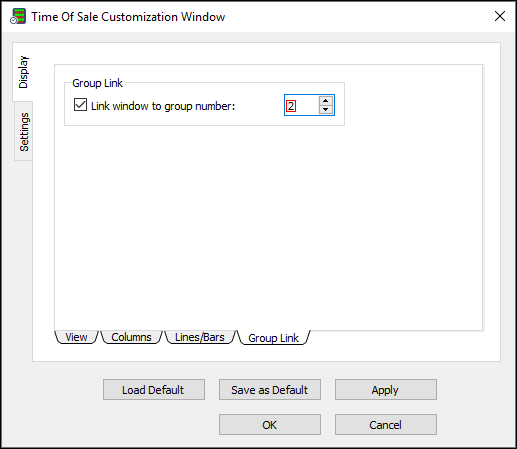
2. Type the number of the window you would like to link the Time of Sales window to.
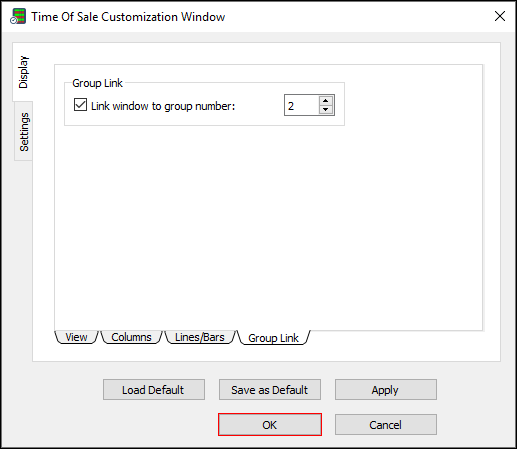
3. Click OK.
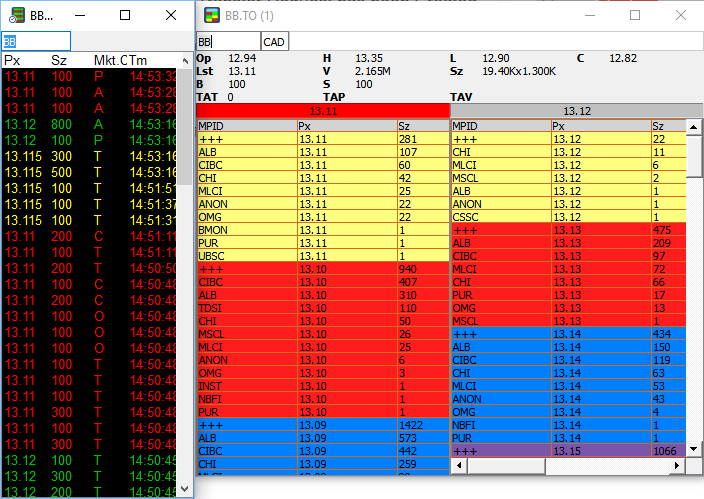
4. After the link is applied, a symbol change in the Time of Sales window causes a change in the symbol and data of the linked window.
Settings
Use the Settings window to customize how data is displayed in the Time of Sales window.
- Click the Settings tab to open the Settings window.
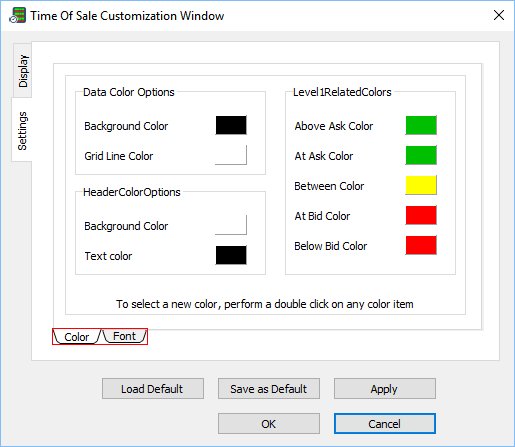
The Settings window contains two sub-tabs: Color and Font.
Color
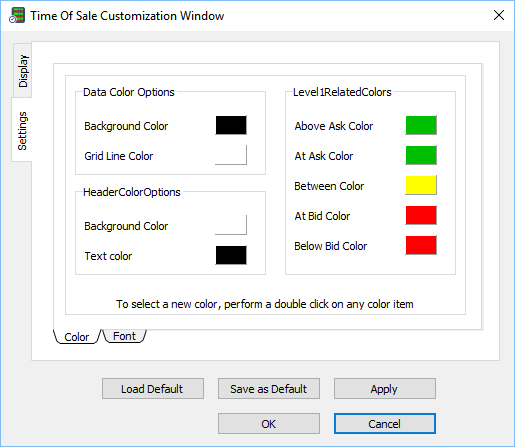
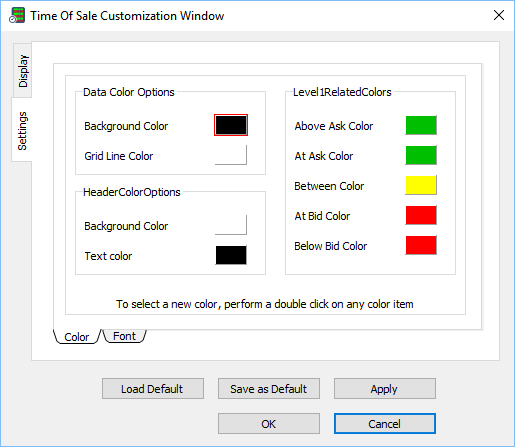
Use the Color window to set the colors for data, Level 1, and the header.
1. Click the Color sub-tab.
2. The Color window appears.
Set a color
1. Double-click the color box next to a feature, for example, Background color under the Data color options heading.
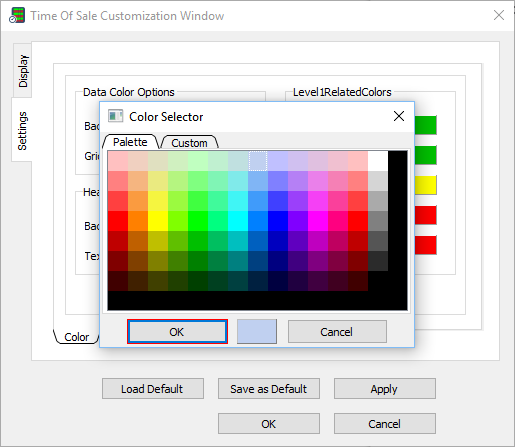
2. The Color dialog window appears. Click a color, and then click OK.
3. In the Color window, click OK.
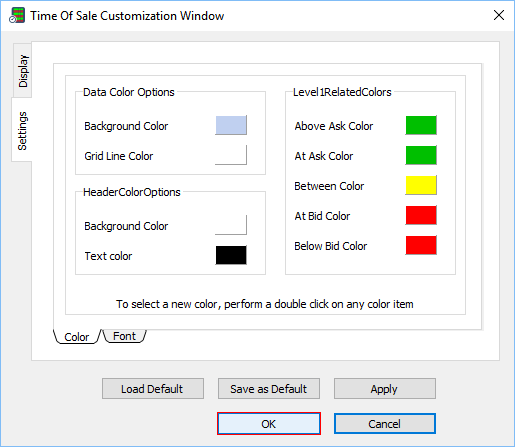
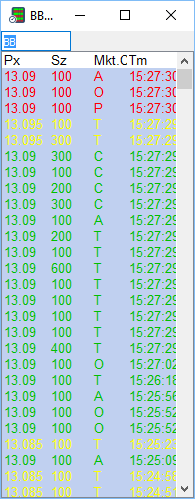
4. The color is set.
Font
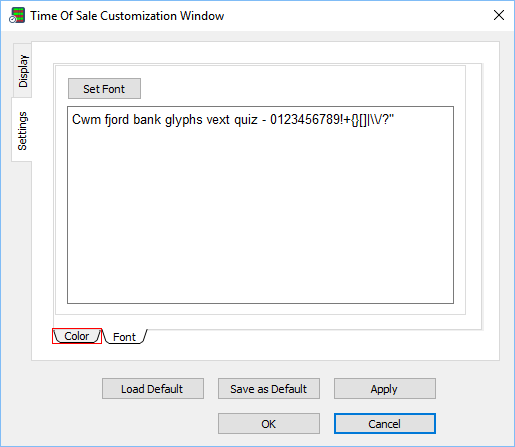
Use the Font window to set the overall font for the Stock Window.
Set a font for the Time of Sales window
1. In the Settings window, click the Font sub-tab.
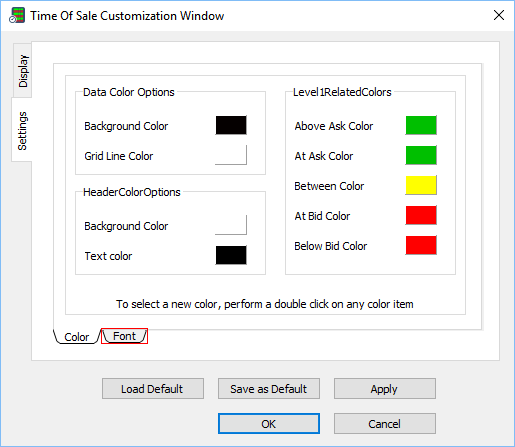
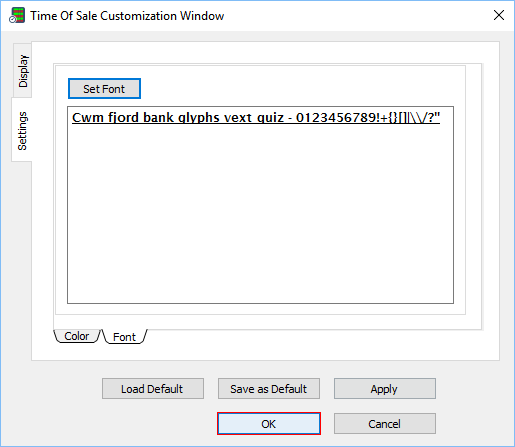
2. The Font window appears.
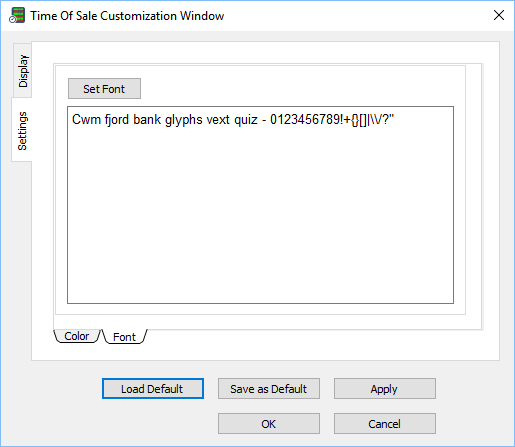
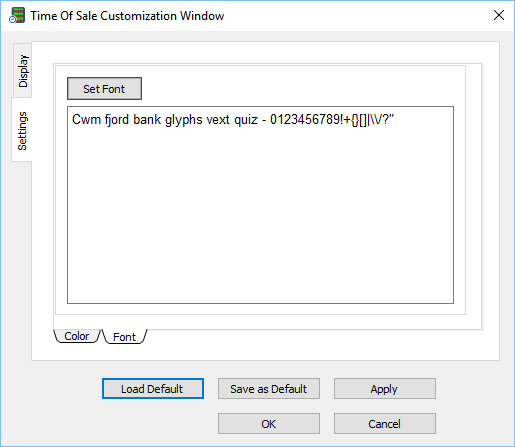
3. Click Set Font….
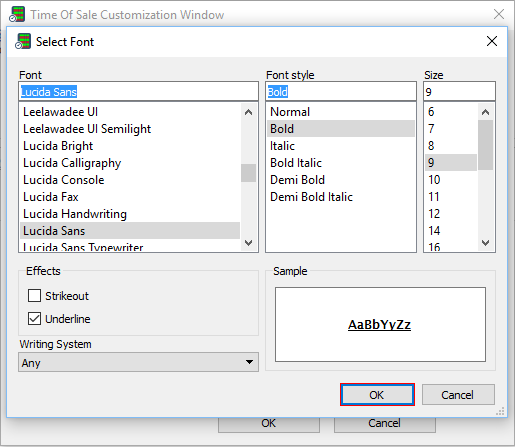
4. The Select Font window appears.
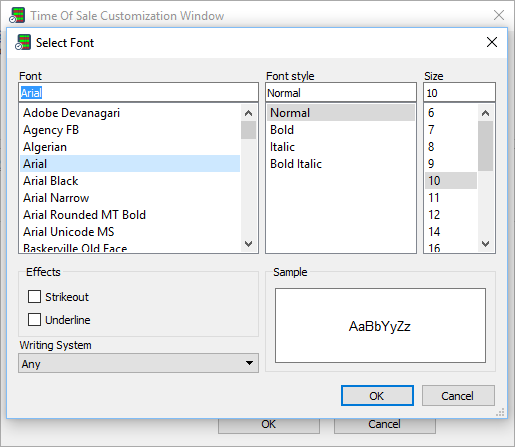
5. Click the font, font style, size, effects, and writing system you want to set. Click OK.
6. In the Font window, click OK.
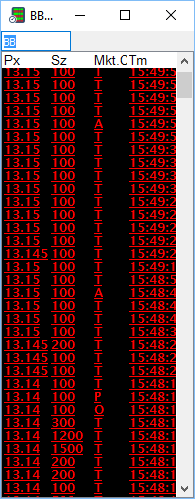
7. The new font appears in the Time of Sales window.
Alignment Editor and Filter Option
Use the Alignment Editor and Filter Option to align columns to the left, center, or right, and to set a filter for the Time of Sales window.
Align a column and activate a filter in the Time of Sales window
1. Right-click a column heading, such as Price, Size, or Mkt. Ctr., in the Time of Sales window.
2. The Alignment Editor and Filter Option appear.
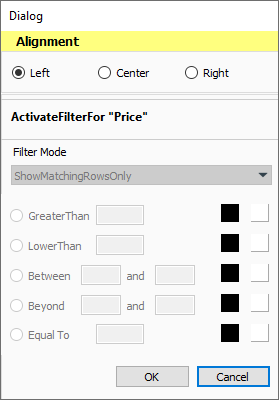
3. In the Alignment section, click Left, Center, or Right to align the column left, center, or right.
4. Click Activate filter for Price to set the filter option.
5. Click a filter parameter option, type a value or values, and double-click the color boxes to set colors for the filter.
New: under the Filter Mode section in the Alfa window, the following options are available for selection:
- ShowMatchingRowOnly
- HideMatchingRows
- HighlightRowOnly
- HighlightCellOnly
6. Click OK.
7. The column is aligned and the filter is activated for the column.
