
Table of Contents
PPro8 Summary
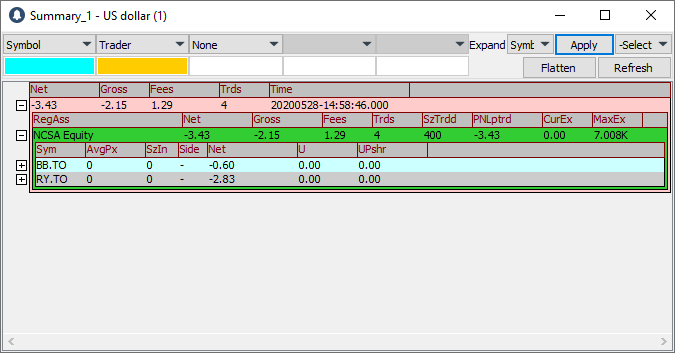
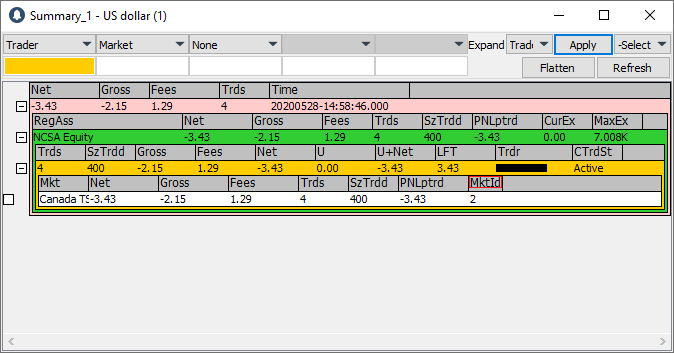
The PPro8 Summary displays the summary of a trader’s activities for the day.
Open a Summary window
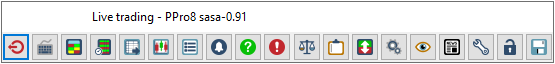
1. On the PPro8 toolbar, click Summary.
2. The Summary window appears.
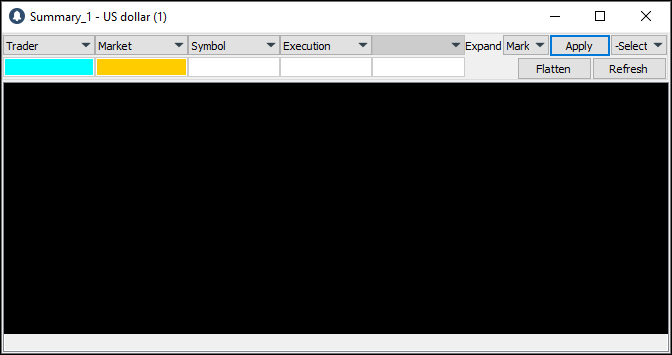
Note: the Summary window is Always Open upon PPro8 login.
Summary Order Edit Box (SOEB)
Use the Summary Order Edit box to manage positions instead of just clicking Flatten. To use this function, follow these steps.
1. Open the Summary window.
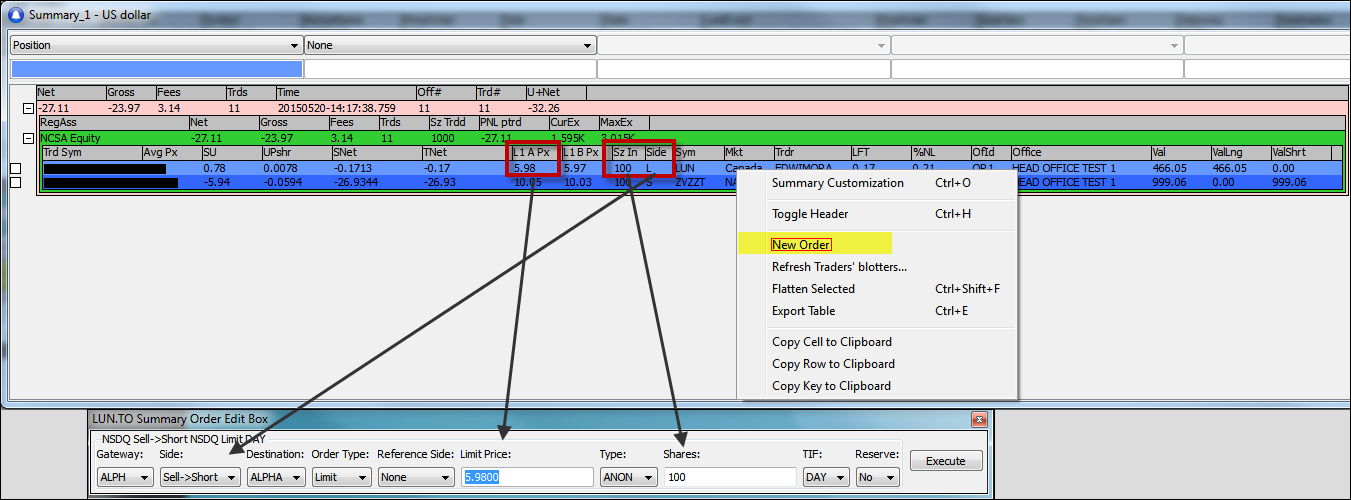
2. Right-click a Position Layer, and then click New Order.
3. The Summary Order Edit Box appears.
4. Click or type order edit information as needed (gateway, side, shares, and other fields).
5. Click Execute.
6. The order is executed with the SOEB.
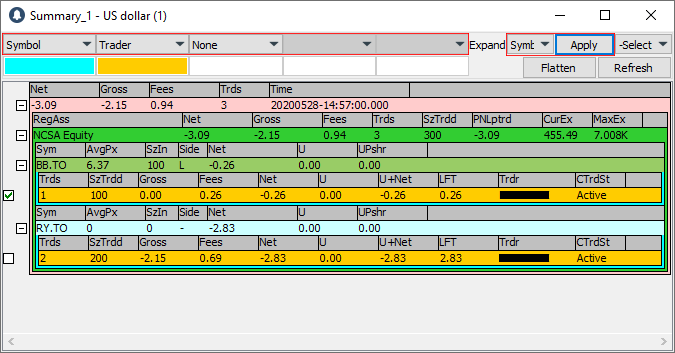
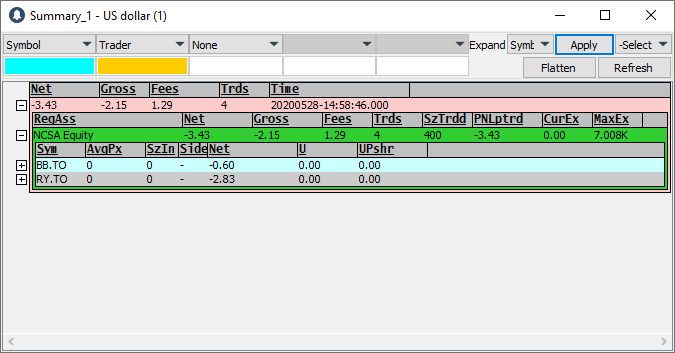
Learn about the Summary window
The Summary window automatically populates with information when an order is accepted. This information appears in Rows and Layers of different colors, which can be customized.
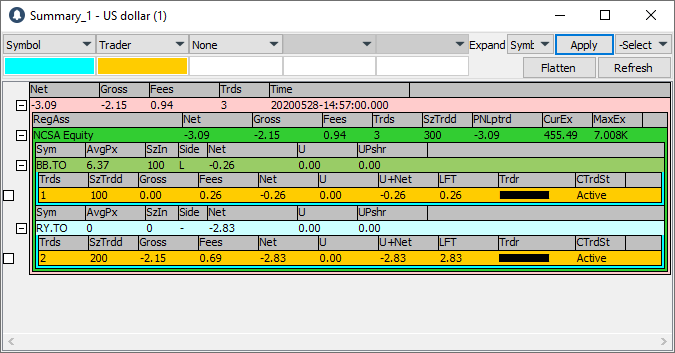
There can be many Rows for a single type. All of them show information summarized by the same characteristic of an execution. You can apply several row types on the Execution information on top of each other, to separate the summarized information by characteristics described on each Row.
There are ten row types in total: Global Total, RegionAsset, Trader, Symbol, Office, Market, Executions, Currency, and Position.
A Layer consists of these Rows added on top of each other. Each Layer shows the summary of information for the Rows on that layer, separated to show only information that matches the Row one Layer above.
When using Summary with several Layers of Rows, you can expand each Row to display further Rows showing information from one Layer below. Executions is always the last Layer on any summary view.
Note: the default currency in Summary: Execution is the local currency specific to the market of the symbol being tracked. For other layers, the default currency is USD.
Layer 1: Layer 2: Execution…
The first Layer aggregates the information for all Executions that match that Layer’s row type. The second Layer aggregates all the information for all Executions that match both the Layer one row above, and the characteristic of that Layer 2 row’s type.
For Trader: Symbols: Execution
The first Layer shows one row per trader. The second Layer shows all the symbols traded by that trader. The third Layer shows all the executions for a symbol by the trader. Each trader row shows the aggregated information for all executions that match a particular trader. Each of the Symbol rows shows the aggregated information for all executions that match both the Trader ID (from the previous Layer) and the symbol from the current row’s Layer.
Expanding and collapsing rows
To display information for several row Layers, expand or collapse a row that has Layers below. When you load the summary it displays only the rows for the top Layer by default. You can then expand the summary view. For individual rows, you can use the Expand/Collapse function. This appears in the form of a plus sign next to each row. Click on the plus sign to expand the row, and on the minus sign to collapse it.
- When a row is collapsed, Summary displays an icon that looks like a square with a plus sign inside it:

- When a row is expanded, Summary displays an icon that looks like a square with a minus sign inside it:

Buttons
Apply: after selecting a set of layers to use for Summary, click Apply to display changes. This button is always enabled and available for use.
Flatten: select the check box next to a row, and then click Flatten to flatten it. A Flatten request will cancel all open orders for the symbol. It will also cancel all scripts on the symbol, provided that the trader has a position or an open order on the symbol.
- New: you can now flatten quickly by Asset Class (Equity/Future/Currency) by selecting an Asset Class from the -Select menu, and then clicking Flatten
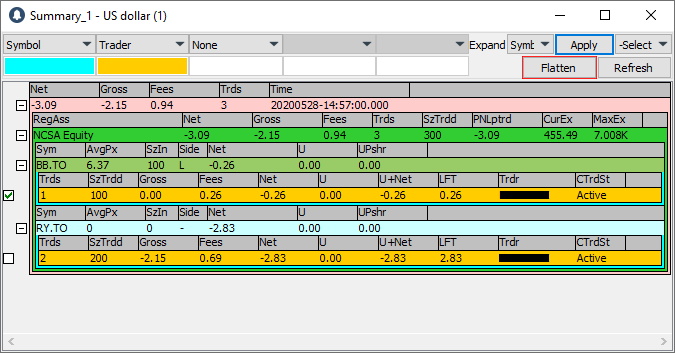
You can also flatten selected positions by right-clicking on the row, and then clicking Flatten Selected; or by using the keyboard shortcut Ctrl + Shift + F.
Note: to prevent large errors, you can automatically flatten only these row types: Symbols, Office, and Trader.
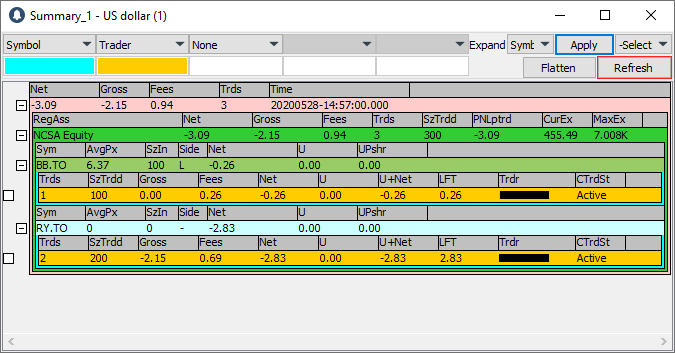
Refresh: use Refresh to request all execution reports for a subset of traders. This is helpful if you lose connectivity or if you believe the data are incorrect. Click Refresh to open the Summary Refresh window.
This window has three panes: Region / AssetClass, Office, and Trader ID.
- Region / AssetClass shows all available regions and asset classes.
- Office shows all offices for which you have rights.
- Trader ID shows all trader IDs in the offices selected in the Office pane.
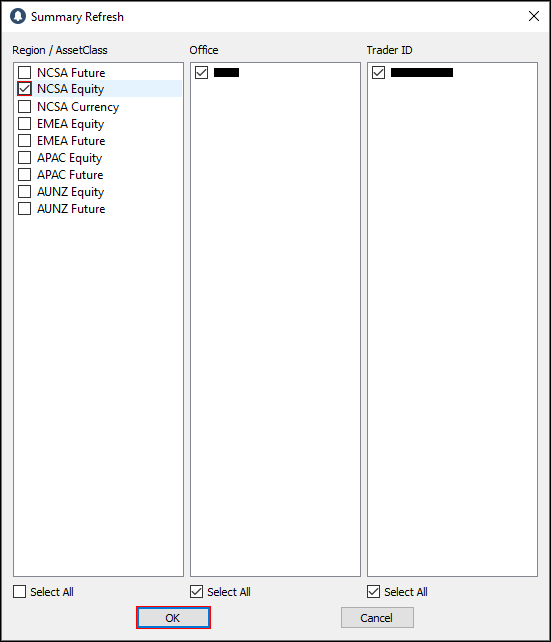
Select a check box for a region/asset class and click OK to refresh. You can also refresh by right-clicking on a row, and then clicking Refresh Traders’ blotters; or by using the keyboard shortcut Ctrl + R.
- Notes:
- It is not possible to request a blotter Refresh while another is still running from either the same Summary window or another instance.
- Summary now reports when the client received an OSTAT while a blotter Refresh was being processed which could cause a bad position or incorrect order state
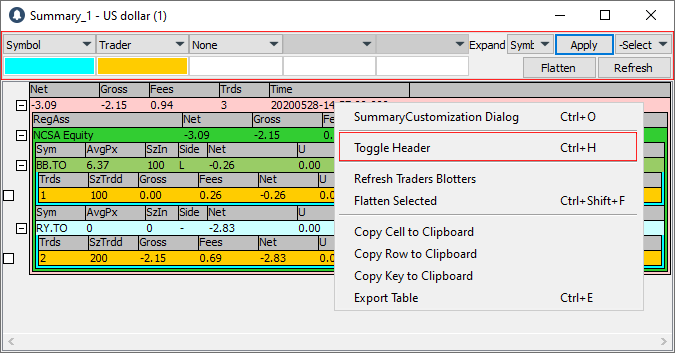
Toggle Header: toggle the display of the Header by right-clicking a row, and then clicking Toggle Header; or by using the keyboard shortcut Ctrl + H.
Add a symbol to an existing symbol list
You can use Summary to add a currently registered symbol to an existing symbol list. This new feature integrates seamlessly with the Symbol List Editor tool, as well as Chart Window, Stock Window, and Time of Sales.
1. Right-click on a symbol layer in the Summary to open the context menu.
2. Point to the Add Symbol to Symbol List menu item.
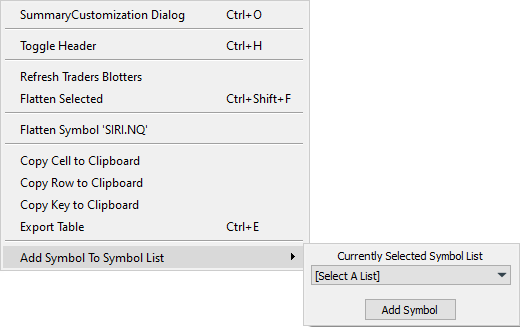
3. The Currently Selected Symbol List view appears. Click [Select A List] to choose the symbol list where you want to add the current symbol, and then click the Add Symbol button.
4. The symbol is added to the symbol list.
5. To remove a symbol from the list, you will need to open the Symbol List Editor tool and delete it there. For more information, you can read the Symbol List Editor manual.
Summary Customization
To make changes to the Summary settings, right-click anywhere in Summary, and then click the SummaryCustomization Dialog menu item to open the Summary Customization window. You can also open it by using the keyboard shortcut Ctrl + O.
This window displays three main tabs on the left: Display, Scope, and Filters.
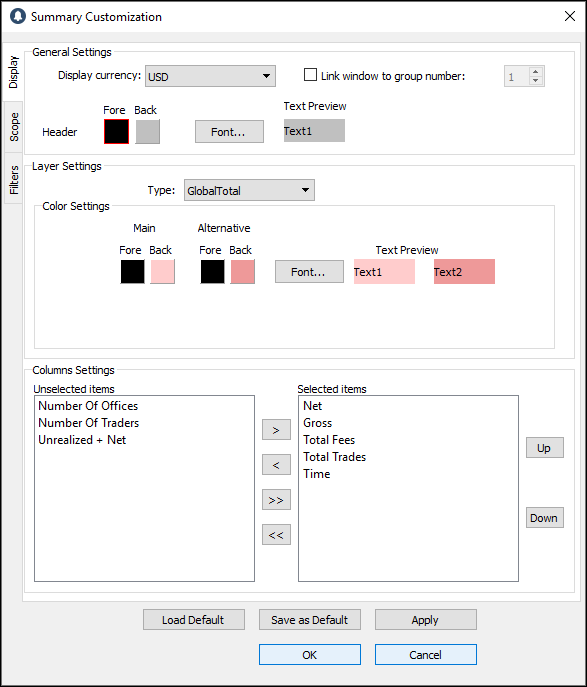
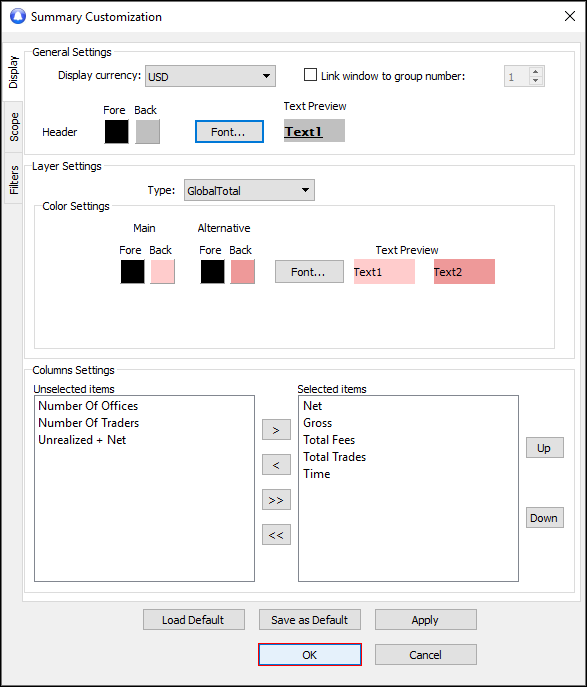
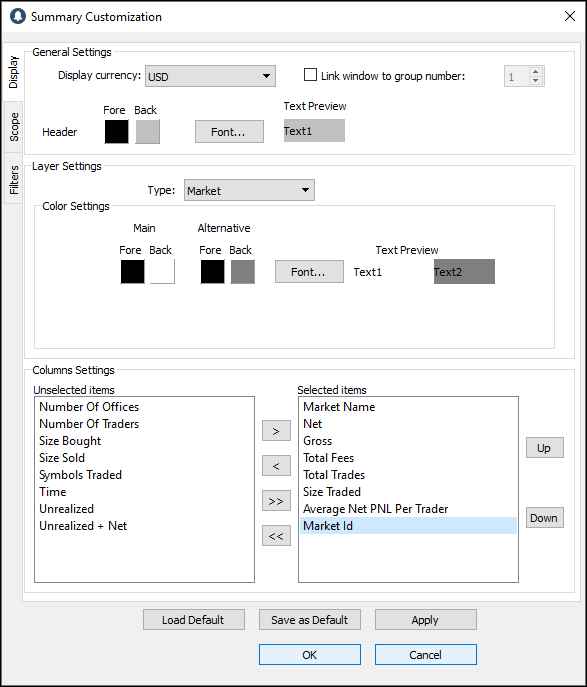
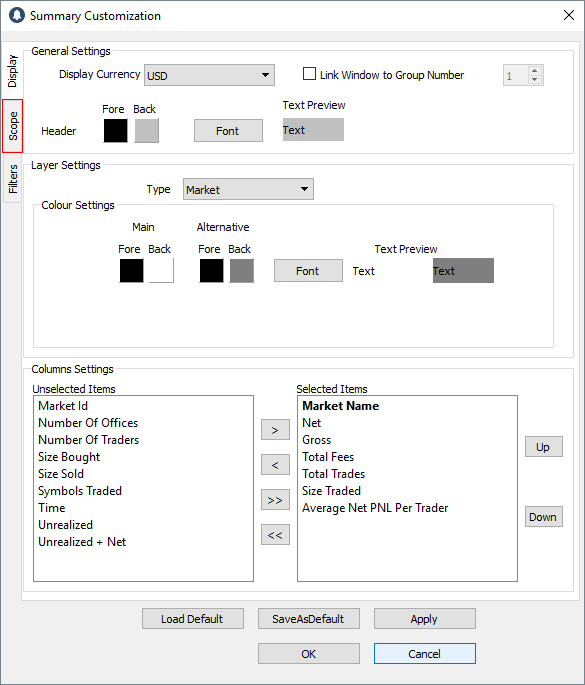
Display
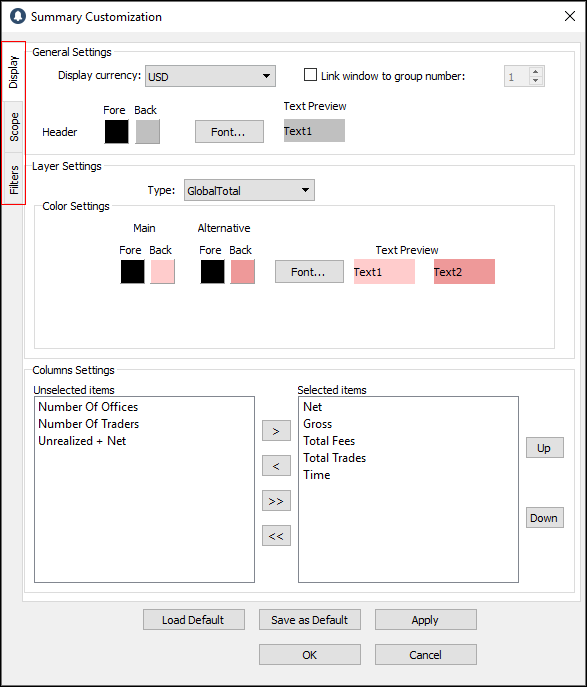
Use the Display window to set the display settings for Summary.
- Click the Display tab to open the Display window.
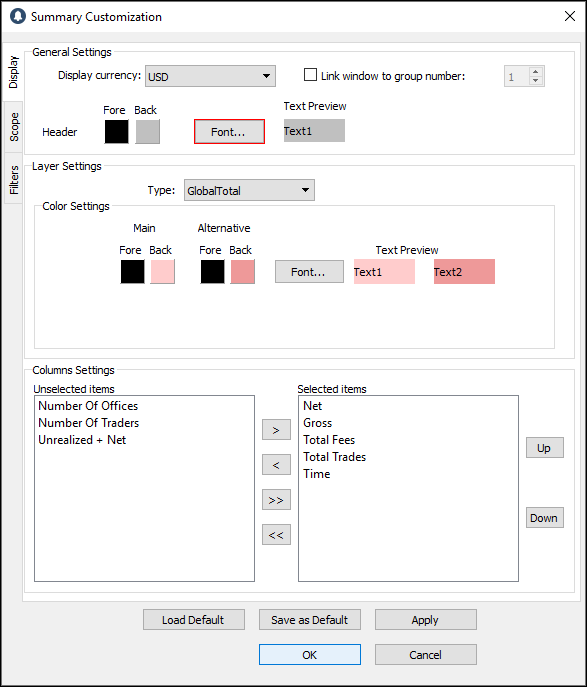
The Display window contains three components: General Settings, Layer Settings, and Columns Settings.
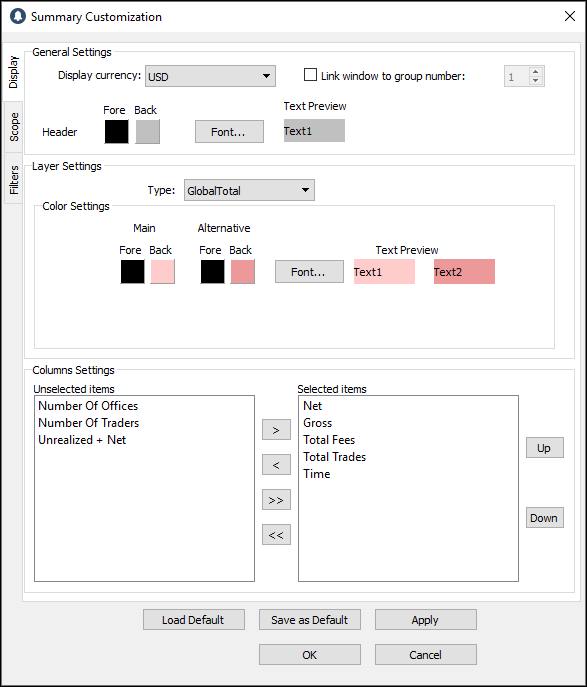
A. General Settings
Change display currency
1. Click the currency you want to set.
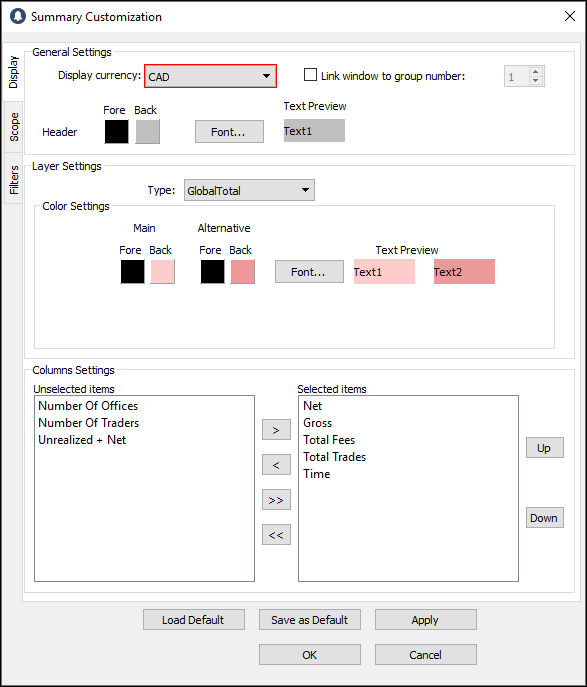
2. Click OK.
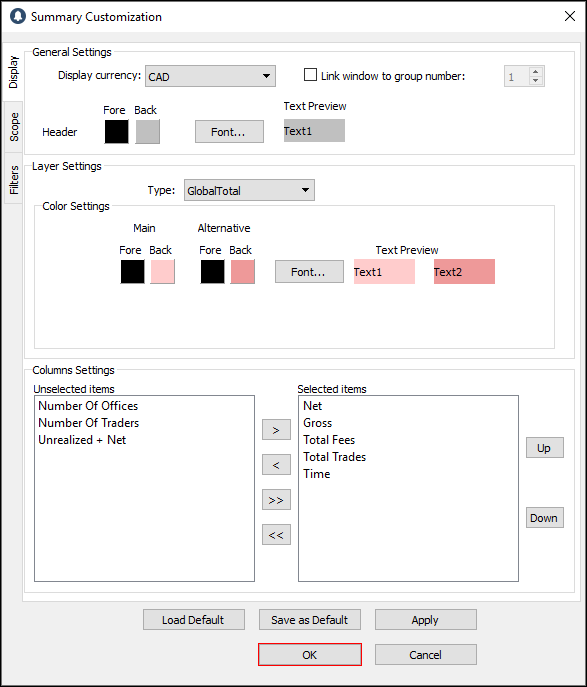
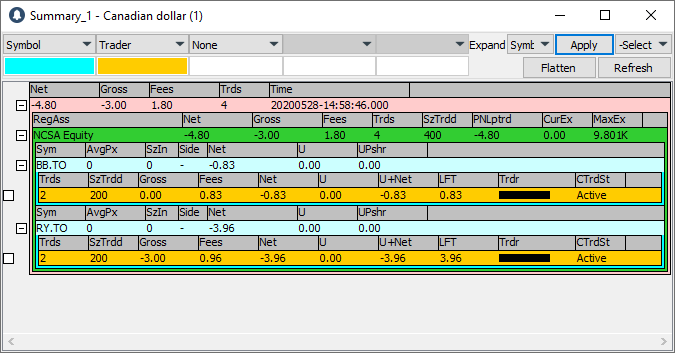
3. The new display currency appears.
Set a color for the Header
1. Double-click the color box next to a feature, for example, Fore (foreground).
2. The Color dialog window appears. Click a color, and then click OK.
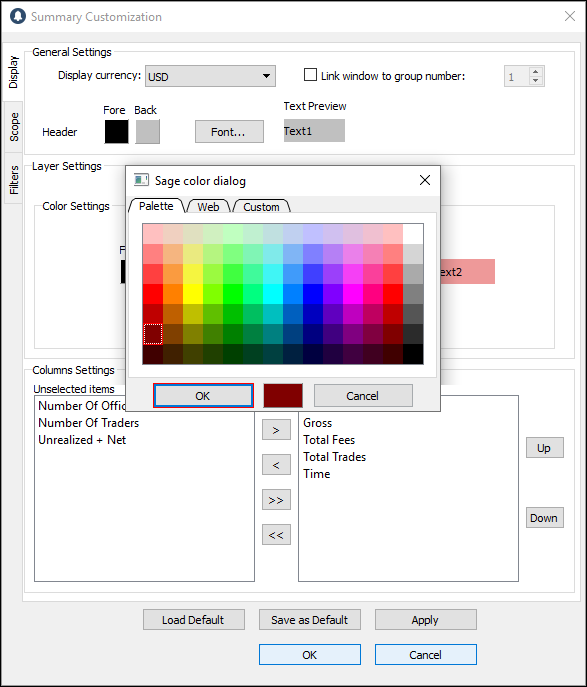
3. In the Summary Customization window, click OK.
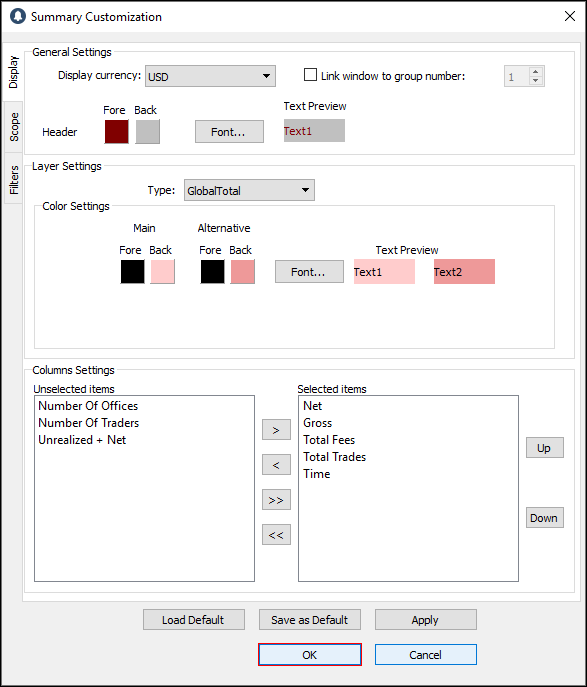
4. The color is set.
Set a font for the Header
1. Click Font….
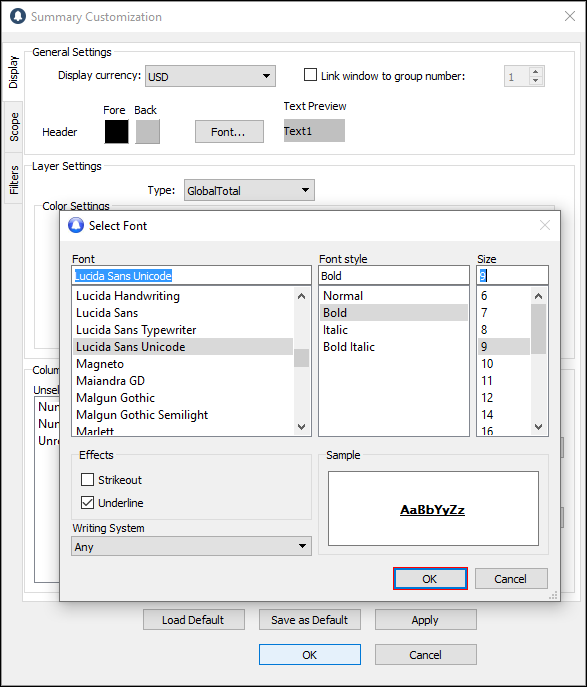
2. The Select Font window appears.
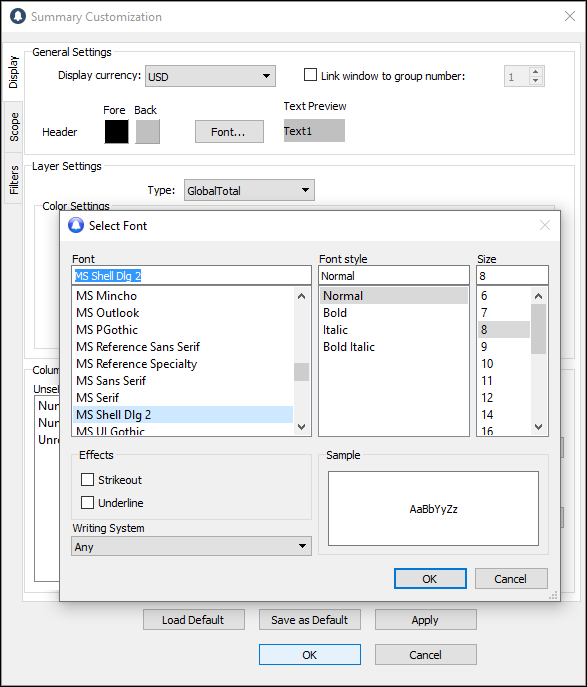
3. Click the font, font style, size, effects, and writing system you want to set.
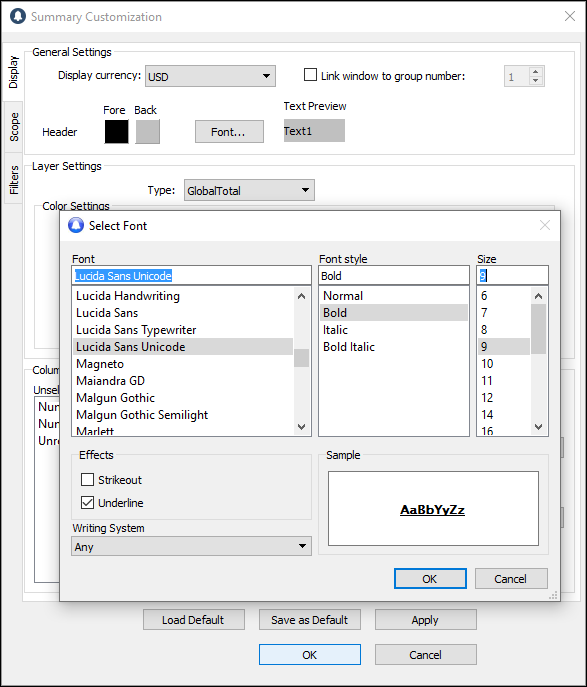
4. Click OK.
5. Next, click OK.
6. The new font appears in the Summary window.
B. Layer Settings
Set a color for a layer setting type
1. Click a layer setting type, for example, Market.
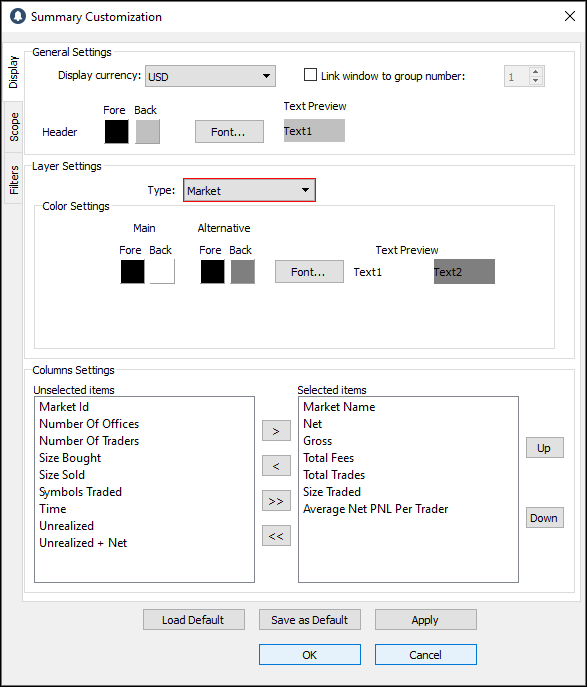
2. Double-click the color box next to a feature, for example, Back (background) under Main.
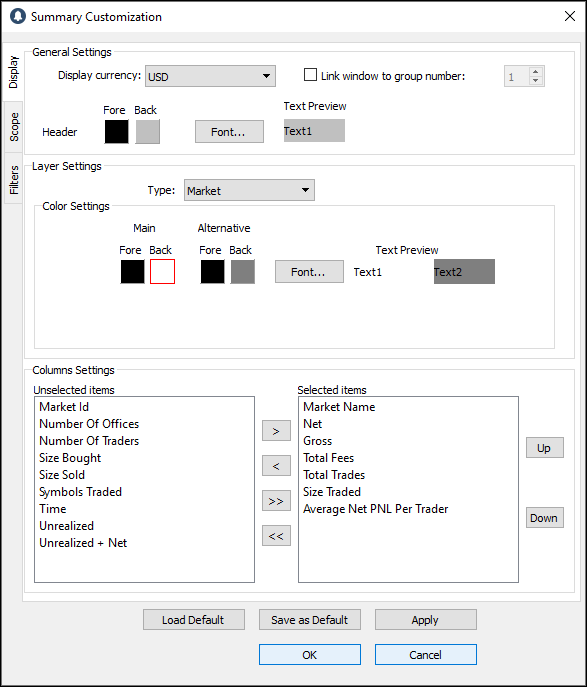
3. The Color dialog window appears. Click a color and then click OK.
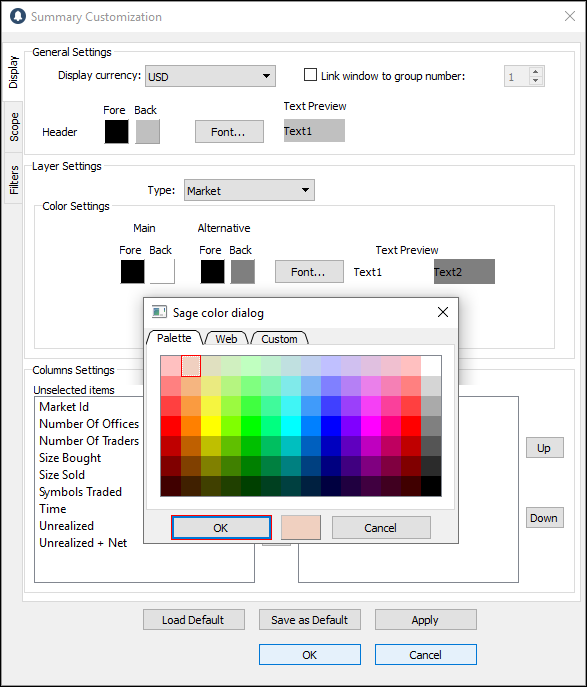
4. Next, click OK.
5. The color is set.
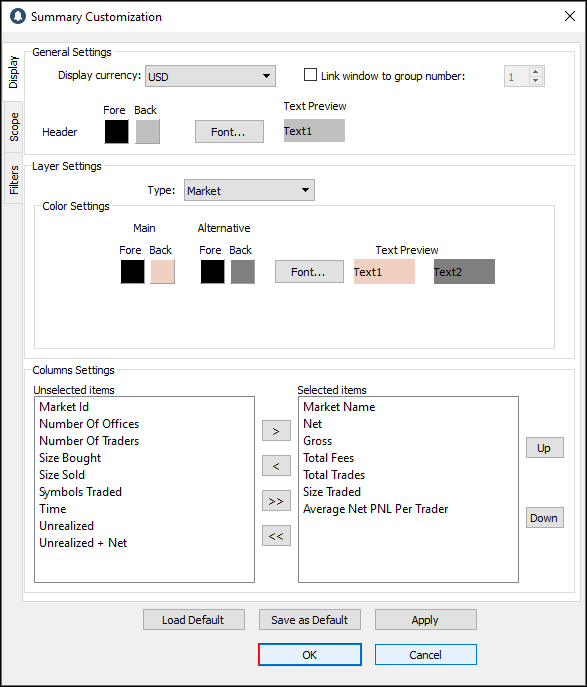
C. Columns Settings
Show a column in Summary
1. Click an item in the Unselected items list.
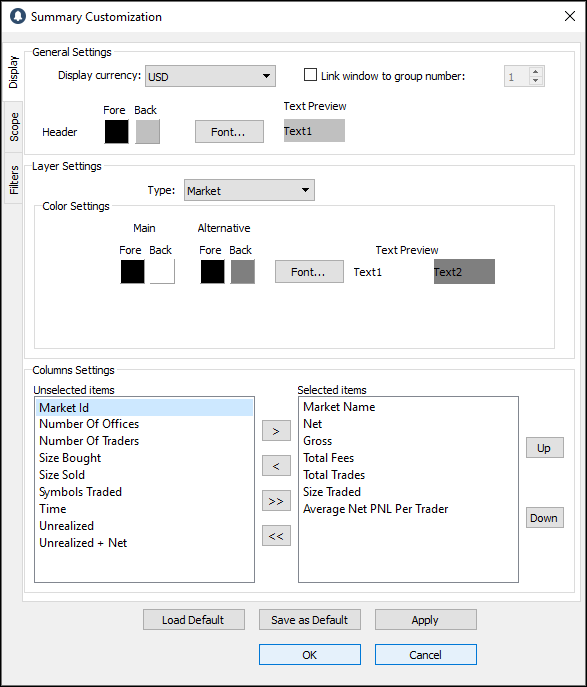
2. Click the right arrow to move the item to the Selected items list.
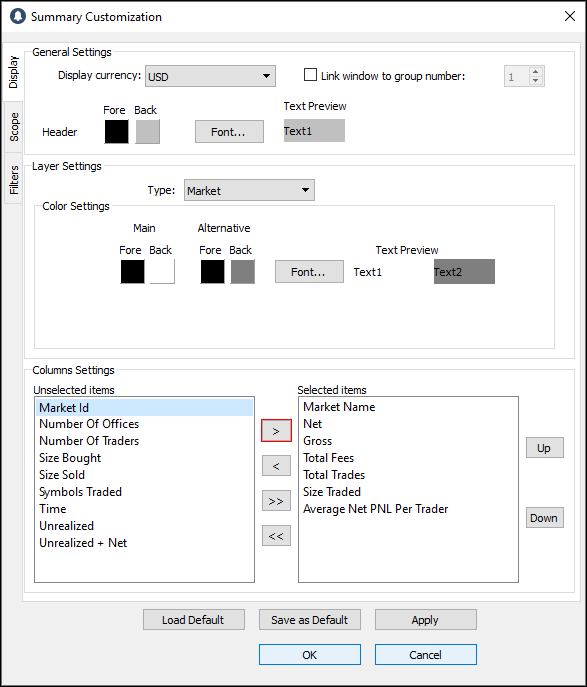
3. Click OK.
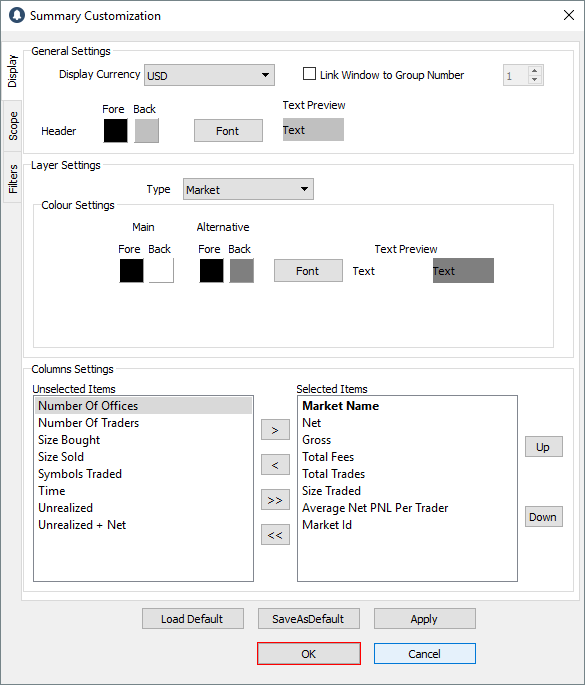
4. The column appears in the Summary window.
Hide a column in Summary
1. Click an item in the Selected items list.
2. Click the left arrow to move the item to the Unselected items list.

3. Click OK.
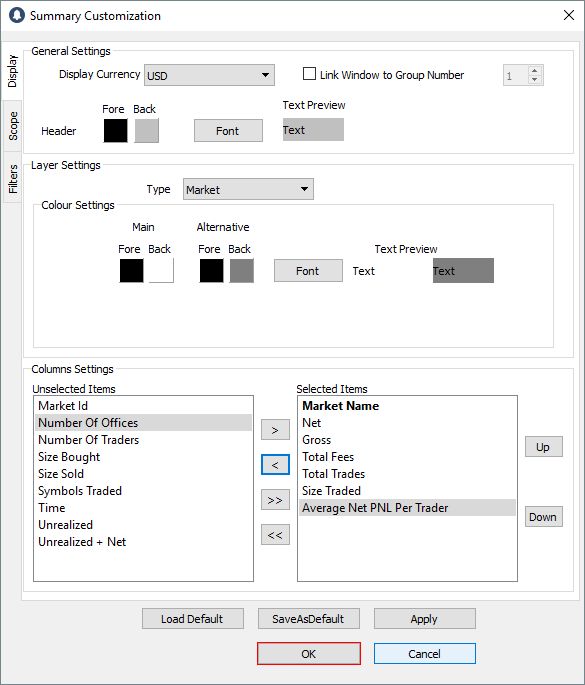
4. The column is hidden from the Summary window.
Scope
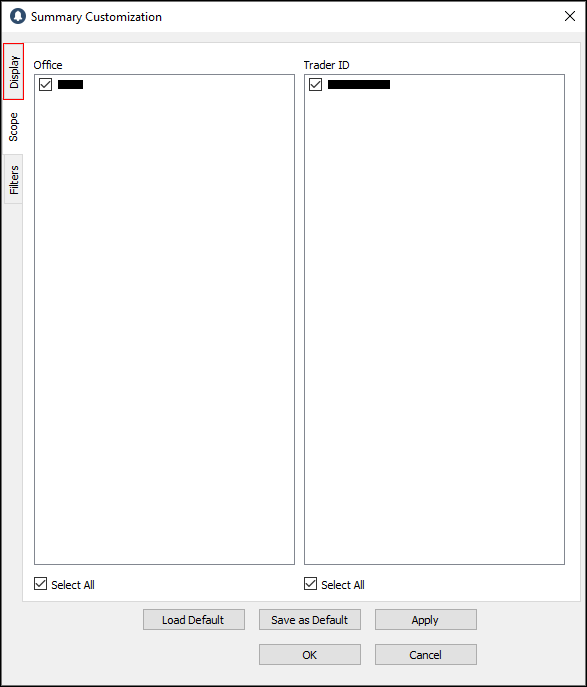
Managers or Operations staff who have the necessary permissions can use the Scope window to limit the offices and trader IDs that appear in Summary and focus on a particular subset of traders in a certain office.
- Click the Scope tab to open the Scope window.
The Scope window contains two panes: Office and Trader ID.
The Office pane shows the offices that a user has permission to see, and the Trader ID pane shows all the traders in the selected office.
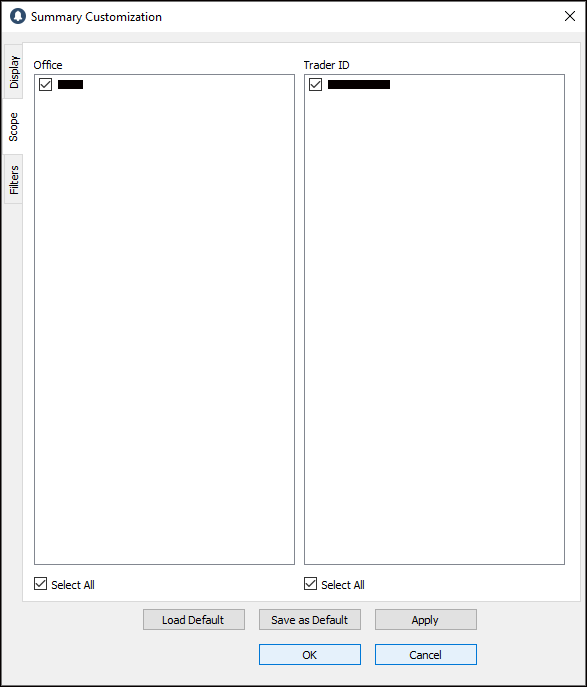
When a change is made to scope, Summary rebuilds using only the OSTATS (order statuses) that match the selected office and trader IDs.
By default, all Offices and all Trader IDs appear as selected in the Scope window.
Filters
Use the Filters window to set filters based on the various row types.
- Click the Filters tab to open the Filters window.
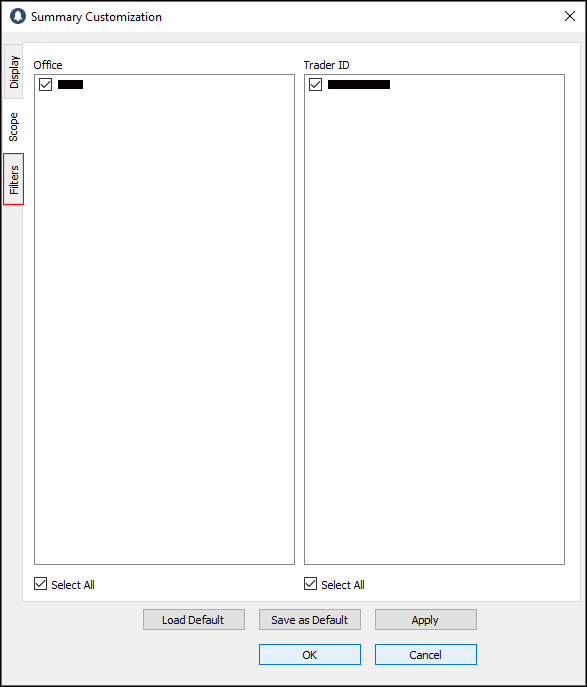
Items in this section vary depending on the Row Type selected.
1. If Row Type = Trader
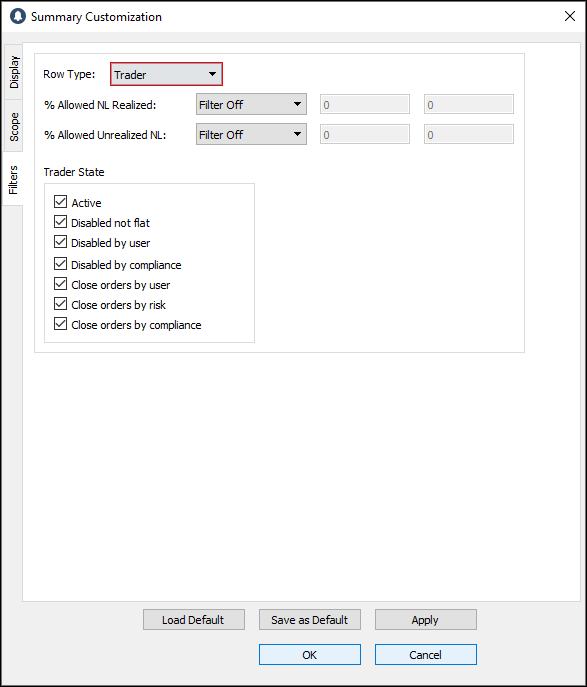
% Allowed NL Realized: if the filter is off, all % of allowed Net Loss realized appears. If the filter is on, the % set by such conditions appears.
% Allowed Unrealized NL: if the filter is off, all % of allowed Net Loss unrealized appears. If the filter is on, the % set by such conditions appears.
Trader State
- Active: the trader is active and able to trade.
- Disabled not flat: the trader is disabled. They cannot place any more orders but have an open position.
- Disabled by user: the trader is disabled by either the trader or by their manager.
- Disabled by compliance: the trader is disabled by the Compliance Team due to an illegal trade or other issue.
- Close orders by user: the trader has reached the maximum allowed NL or LFT, or has sent an illegal trade, and has a set amount of time left to flatten the position.
- Close orders by risk: the Risk Team set the trader as “Close Orders by Risk Issue.” The trader can flatten their positions before time runs out.
- Close orders by compliance: the Compliance Team set the trader as “Close Orders by Compliance Issue.” The trader can flatten their positions.
2. If Row Type = Symbol
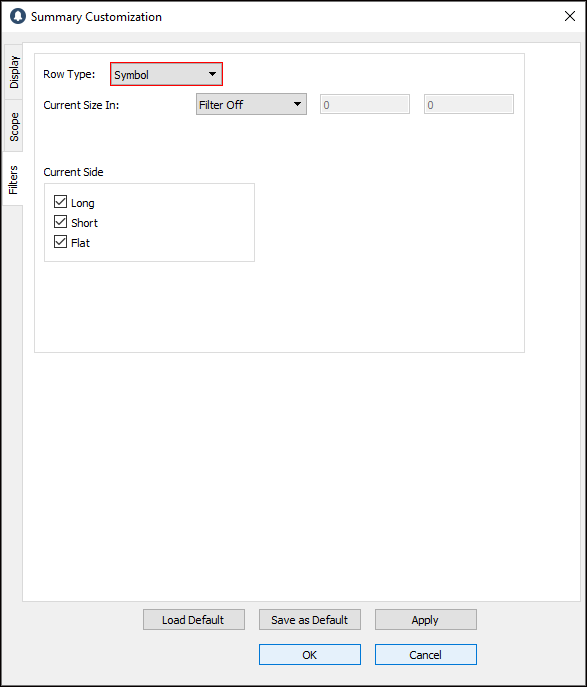
Current Size In: the number of shares the trader trades.
Current Side: when the appropriate check boxes are selected, Summary shows values for Long, Short, and Flat positions.
Export summary data
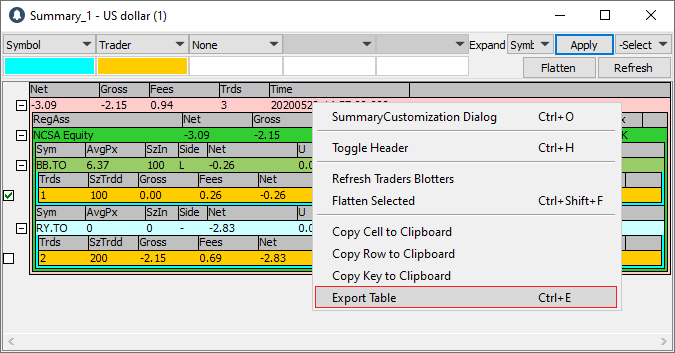
1. Right-click anywhere in the Summary window, and then click Export Table. Or, use the keyboard shortcut Ctrl + E.
2. The Select Directory window appears.
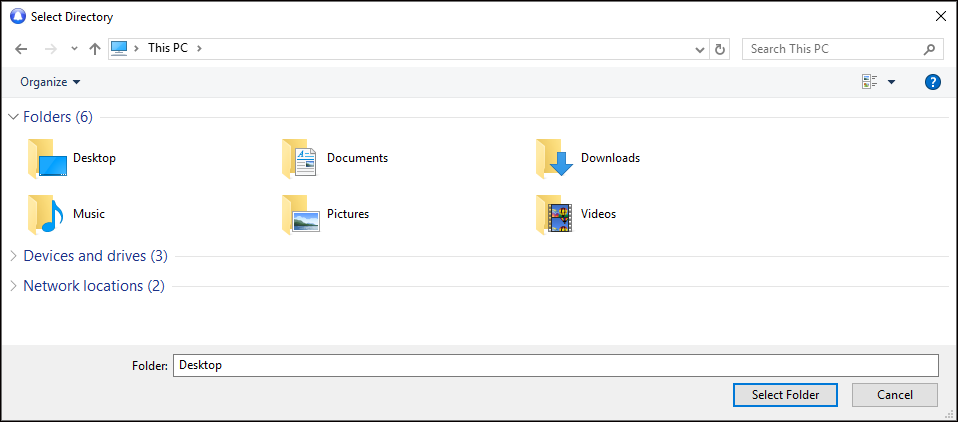
3. Find and click the folder where you want to save summary data.
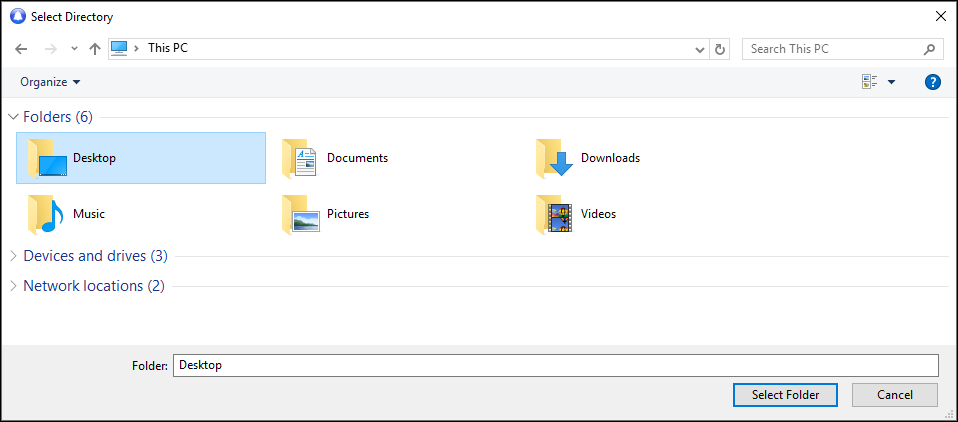
4. Click Select Folder.
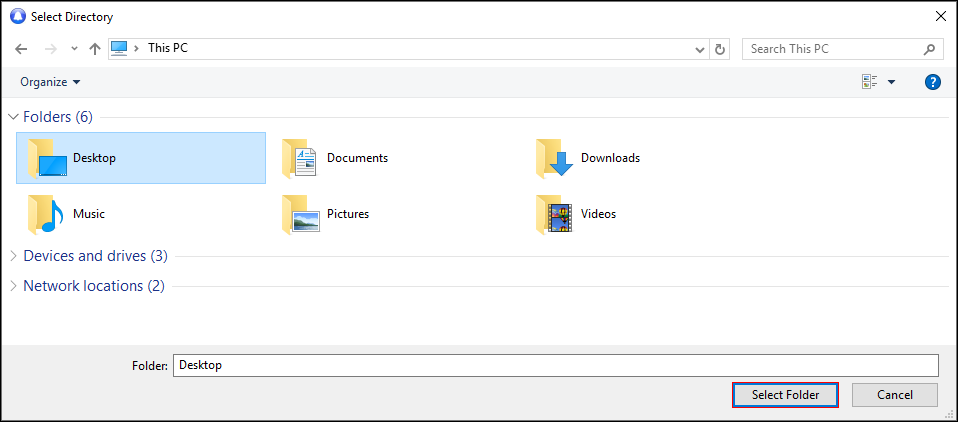
5. The data is exported to CSV files.
*Note: the export process generates one CSV file per summary layer. Each CSV file contains all the columns appearing in a layer, as well as a column for each layer above. The data in these files reflect the current view in Summary. File names are set as follows: “Summary” + layer name + current date, for example, “SummaryGlobalTotal2015-01-13_10-40-34”. Lower-level files include the preceding levels in the file name.
Copy Summary Data
1. Right-click a cell or row.
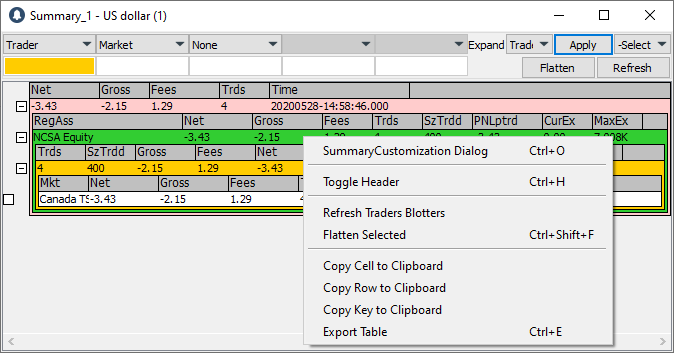
2. Click Copy Cell to Clipboard, or Copy Row to Clipboard, or Copy Key to Clipboard, as needed.
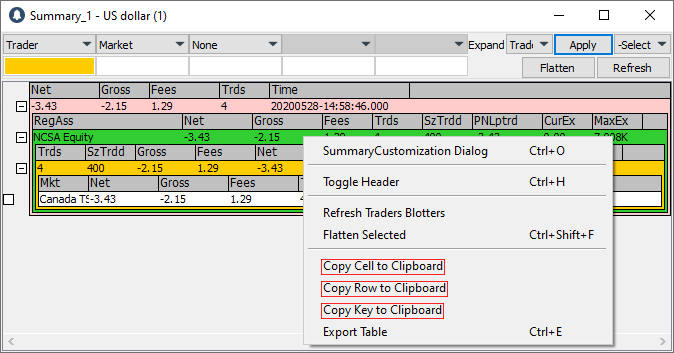
3. The cell, row, or key is copied to the clipboard. You can now copy and paste it where you choose.
Update Gross PnL by Region-Asset Class
This feature allows trader’s to update their Gross PnL by Region-Asset Class. This is intended to serve as a psychological-aid to help traders focus on their trading, and less on current PnL. The impact is only superficial — affecting what appears in that Summary instance. The changes are on the client side only and as a result will not impact risk, or other user’s (ie. manager) views of the trader’s activity.
1. Right click on the Summary Window, and select “SummaryCustomization Dialog.”

2. Select the “Options” tab.

3. From this menu, you will be able to input the amount of gross PNL you would like to remove, for the specified region asset class. 4. Once entered, you will see that your Gross, as displayed in that Summary instance has been reduced by your input value.
- Note: Only whole numbers (integers) can be entered as acceptable values.
- Note: Fees are not affected.
- Note: Only impacts global and region asset class layers, and will not affect trader and symbol layers.
Accessing Order Status Inquiry Tool
This tool allows you to view the status of your orders.
1. Open the execution layer by expanding any symbol in the Summary Tool.
2. Right click the execution, and select “Order Status Inquiry” from the pop up menu.

3. This will open up a new dialog box, providing the details of the identified execution.
