This is an old revision of the document!
Table of Contents

PPro8 is the leading trading platform that Day Trade The World™ uses to access global markets. DTTW™ traders can trade where they want, when they want, because our servers are located in data centers1) all around the world.
Click on a button or link below to learn more about each PPro8 tool.
Login
To log into PPro8, follow these steps.
1. Double-click the PPro8 application icon on your computer's desktop  .
.
2. The login window appears.
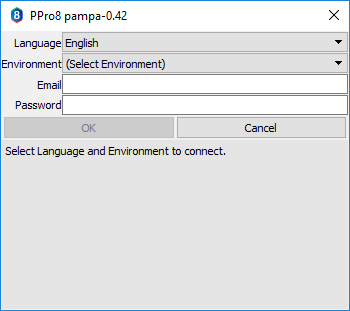
3. Select a language (English, Spanish, Russian, or Chinese).
4. Select an environment (Live or TMS).
5. In the User name field, type your Metro-registered email address. In the Password field, type your Metro/PPro8 password.
6. Click Ok.
7. The client logs you in and you can start trading.
Minimum Recommended Hardware Requirements
Internet Connection
- Wired LAN (not wifi)
- Minimum 5MBps bandwidth
Note: when choosing an Internet service provider, we recommend that you find a provider who services business customers. You should get a business service with a minimum of 5Mbps bandwidth (more as your office grows). We do not recommend using residential Internet services as their quality is generally inferior to those offered to businesses.
Switch
- You can use any switch. Remember that you need one (or more) to provide for sufficient ports to connect all your workstations.
Workstation
- Third-Generation Intel Core i5 or i7 series processor
- 3 GB RAM
- 60 GB Hard Drive
- OS: Windows 7 (SP1), Windows 8, or Windows 10
>Back to Top
PPro8 Basket Order
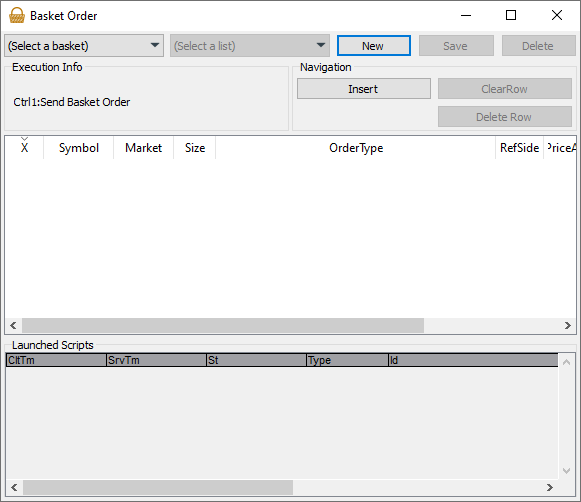
Use the Basket Order tool to set a command to send orders on a group of symbols.
Note: order types set in Keyboard Setup and clicked in Basket Order must be the same. If you change an order type in Keyboard Setup, make the change in Basket Order to match.
Open the Basket Order window
1. On the PPro8 toolbar, click BasketOrder.

2. The Basket Order window appears.
Set up a Basket Order
1. Open the Basket Order window.
2. Click New.
3. Select a list in the (Select a list) menu (see the Symbols List Editor manual to learn how to create a list).
4. The symbols for that list appear. Click and type in the blank cells for each symbol to set its parameters (Size, OrderType, RefSide, PriceAdj, and Price).
5. Select the check box for each symbol you want to include in the basket order.
6. Click Save, type a name for the list, and then click OK. Your new basket order is saved.
7. To send the basket order, click (Select a basket), click the name of the basket, and then press Ctrl + 1 to send.
Note: to send a basket order, the Basket Order window must be on Top.
>Back to Top
PPro8 Chart Window
Use the PPro8 Chart Window to display charts that can help with trading decisions.
Open a Chart Window
1. On the PPro8 toolbar, click ChartWindow.

2. An empty Chart Window appears.
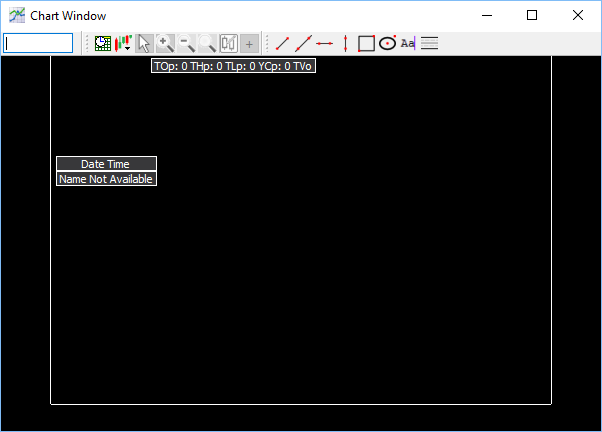
Chart Window components
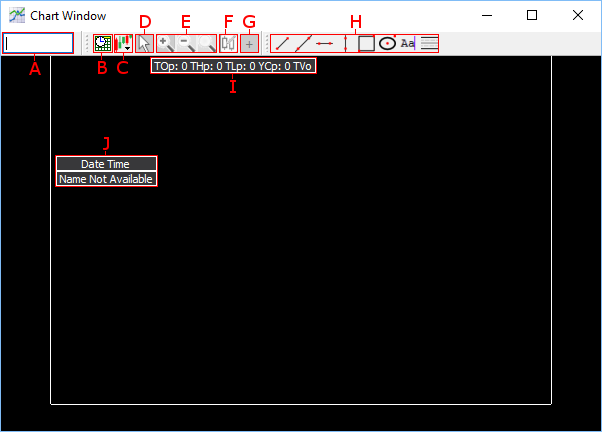
A. Symbol Box: type the symbol (for example, BB), press Tab, click the market extension (for example, TO), and press Enter to load the chart.
B. Time Interval: click to open the Chart Interval window, and type in values to set the time interval.

C. Chart Type: click the option for the type of chart you want to draw, either Candle Stick, OHLC Bar, or Long/Short Line.
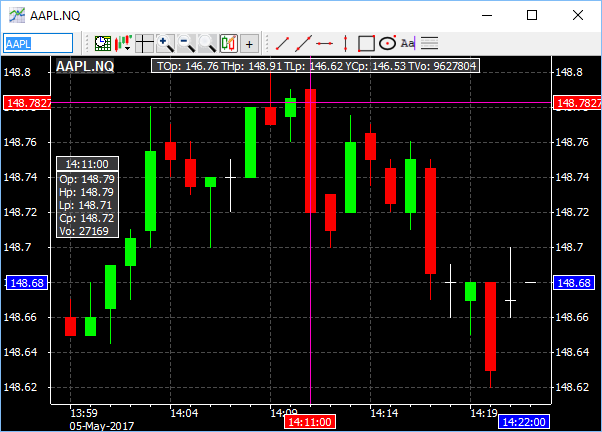
D. Cursor button: click either NormalMouseMode or CrossCursor to either add or remove a coordinate system to the cursor to help read time and price information.
E. Zoom In/Zoom Out/Zoom Reset: click the appropriate button to zoom in or zoom out and view a specific interval movement.
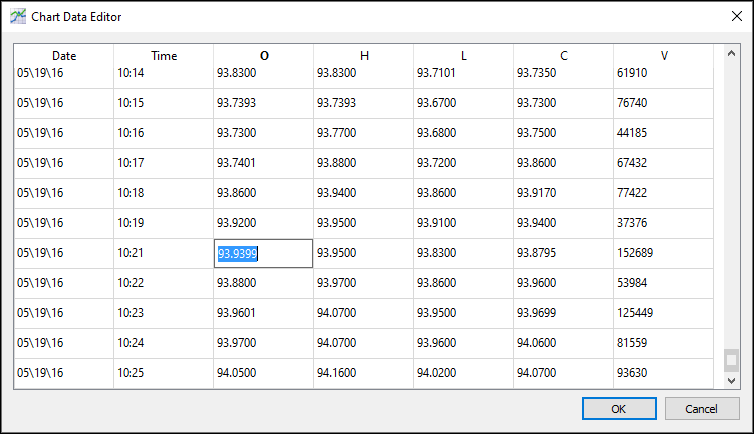
F. Data Editor: manually change the data that displays in the Chart Window. When a bad print appears in the Time of Sales window, it triggers a visible, incorrect change in price or volume in the Chart Window for a specific minute. You can set the Cursor to CrossCursor to identify the minute when there is a bar that needs to change. To make this change, open the Data Editor, type the correct value, click OK, and the Chart Window updates.
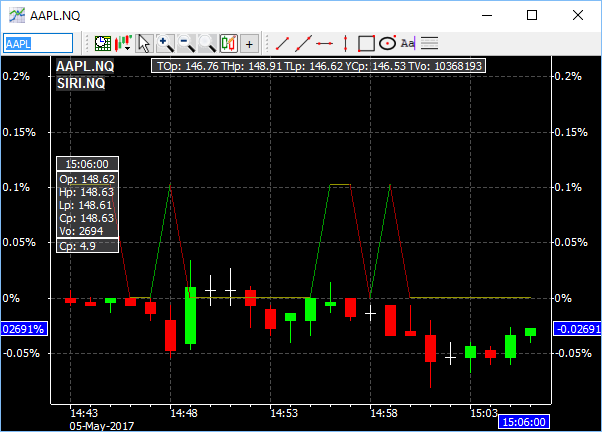
G. Add Symbol: click to open the Chart Window Customization: Multiple Symbols view, where you can add or remove multiple symbols for comparison in the Chart Window.
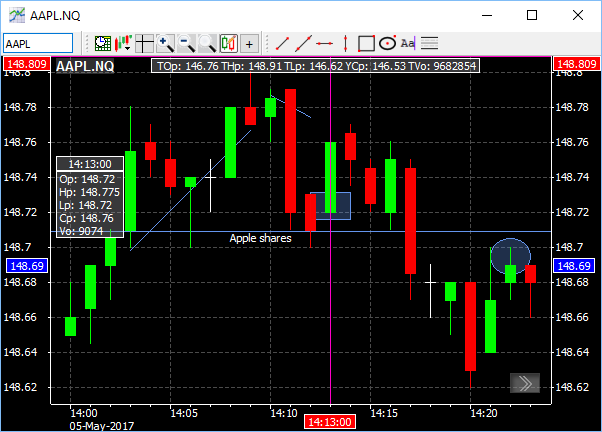
H. Drawing Tools: use the drawing tools to draw elements like lines and shapes, and to add text notes, as follows:
- click DrawSegmentedLine to draw a segmented line
- click DrawExtendedLine to draw an extended line
- click DrawHorizontalLine to draw a horizontal line
- click DrawVerticalLine to draw a vertical line
- click Draw Polygon to draw a polygon
- click Draw Ellipse to draw an ellipse
- click InsertText, and then type to insert text
- click Draw Fibonacci Retracement to draw Fibonacci retracement lines
- to edit a drawing element, right-click it, point to the element name (for example, Ellipse), point to Edit, and then select editing options
- to delete a drawing element, right-click it, point to the element name, and then click Remove
I. OHLC Titlebar: view daily values, including opening price, high price, low price, yesterday's closing price, and volume.
J. OHLC Info: view the symbol’s Open Price, High Price, Low Price, and Closing Price, as well as Volume, for the trading day.
Send order from Chart Window
You can send orders when Chart Window is open and on Top. To use this function, enable the Order Edit Box feature in Customization, and then follow these steps.
1. Set up keyboard shortcuts with Keyboard Setup.
2. Open a new Chart Window.
3. Type the symbol and market extension, and then press Enter.
4. Type a keyboard shortcut.
5. The order edit box appears.
6. Edit the order (type values in the Limit Price and Shares fields as needed), and then press Enter to execute.
7. The order is sent from the Chart Window.
Note: click SaveLayout on the PPro8 toolbar to make the order edit box remember its position on the screen when re-opened again.
Chart Window Customization
To make changes to the Chart Window settings, right-click anywhere in the Chart Window to open the Chart Window Customization window. This window displays three main tabs on the left: Display, Indicators, and Multiple Symbols.
Note: a symbol must be loaded in the Chart Window before you can open Customization.
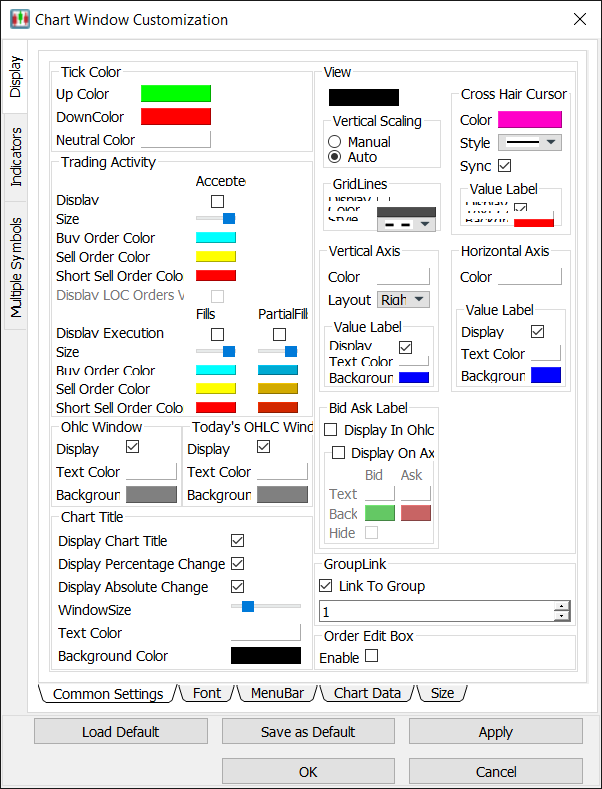
Display
Use the Display window to adjust the display settings for the Chart Window.
- Click the Display tab to open the Display window.
The Display window contains five sub-tabs: Common Settings, Font, Menu Bars, Chart Data, and Size.
Common Settings
Use the Common Settings window to adjust color and layout settings for the Chart Window.
1. Click the Common Settings sub-tab in the Display window.
2. The Common Settings window appears.
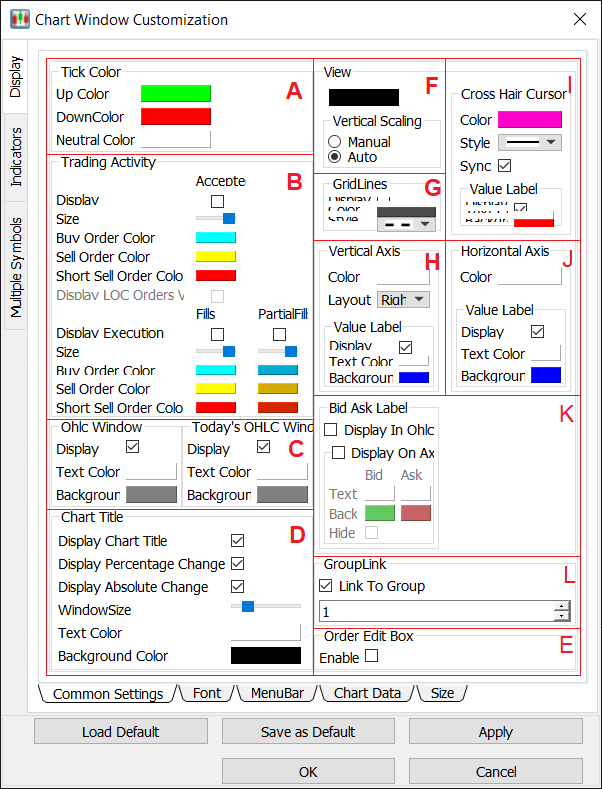
A. Set tick color
1. In the Common Settings window, double-click the color box for either of the three options (Up Color, Down Color, or Neutral Color).
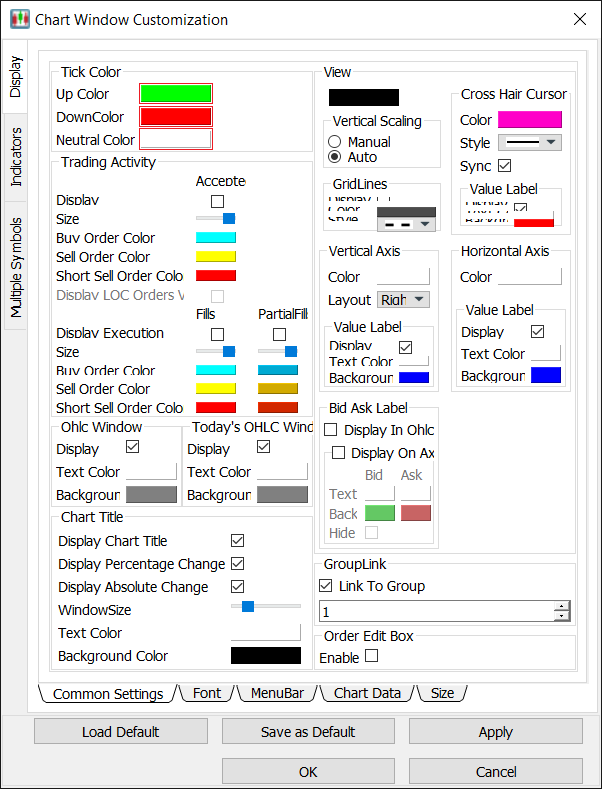
2. The Color Selector window appears. Click a color, and then click OK.
3. In the Customization window, click OK.
4. The tick color is set.
B. Adjust trading activity mark settings
1. In the Common Settings window, select or clear the check boxes for the Display Accepted Order and the Display Execution options to hide or display them.
2. Double-click the color box for either of the three color options (Buy Order Color, Sell Order Color, or Short Sell Order Color).
3. The Color Selector window appears. Click a color, and then click OK.
4. In the Customization window, click OK.
5. The trading activity mark options are set.
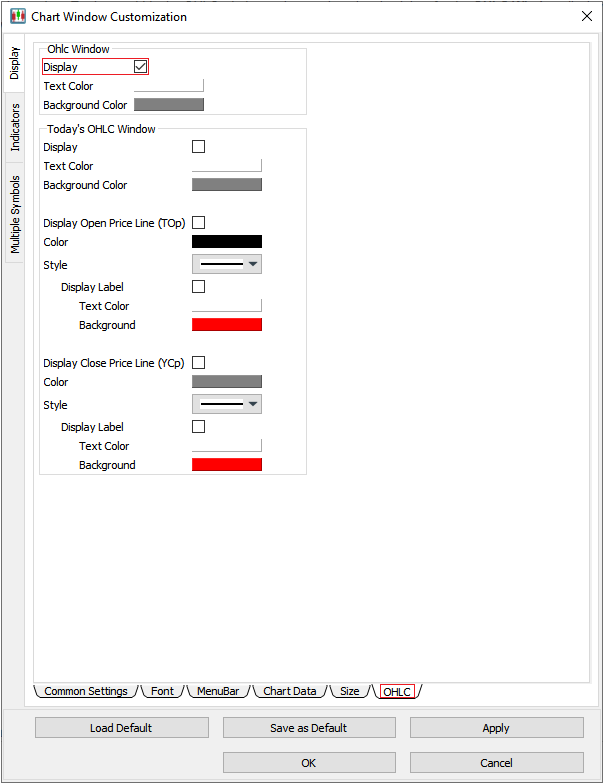
C. Display or hide the OHLC Window
- Select or clear the check box for the Ohlc Window display option to show or hide the OHLC Window.
D. Adjust Chart Title settings
1. In the ChartTitle section, select or clear the check box for the Display Chart Window option to show or hide the title of the chart (i.e., the symbol name).
2. Move the WindowSize slider to the left or to the right to adjust the size of the chart title.
3. Double-click the color box for either of the two color options (Text Color or Background Color).
4. The Color Selector window appears. Click a color, and then click OK.
5. In the Customization window, click OK.
6. The chart title options are set.
E. Enable or disable the Order Edit Box
- Select or clear the check box for the Enable option to enable or disable the Order Edit Box feature in the Chart Window.
F. Link Chart Window to a group
- If this option is selected, the Chart Window is grouped by number with other tools, such as the Stock Window and the TOS Window. Other windows in the window group of the same number change their symbol to correspond to the symbol in the Chart Window.
Adjust View settings
G. Set Chart Window background color
1. In the View section, double-click the color box for Background color.
2. The Color Selector window appears. Click a color, and then click OK.
3. In the Customization window, click OK.
4. The background color is set.
G. Set Vertical Scaling
1. In the Vertical Scaling section, click the Manual or Auto option to set vertical scaling to manual or automatic.
2. In the Customization window, click OK.
3. The vertical scaling is set. When vertical scaling is set to manual, clicking and dragging the vertical axis up or down changes the scale.
H. Set Grid Lines
1. In the GridLines section, select or clear the Display check box to show or hide grid lines.
2. Double-click the color box, click a color, and then click OK.
3. Click the grid style you want to set in the Style menu.
4. In the Customization window, click OK.
5. The grid lines are set.
I. Set Vertical Axis
1. In the Vertical Axis section, double-click the color box, click a color, and then click OK.
2. In the Layout menu, click Left, Right, or Both.
3. In the Value Label subsection,
- select or clear the Display check box to show or hide the value label;
- double-click the color box for Text Color, click a color, and then click OK;
- double-click the color box for Background Color, click a color, and then click OK.
4. In the Customization window, click OK.
5. The vertical axis is set.
J. Adjust BidAsk Label settings
- Select or clear the DisplayInOhlcWindow check box to show or hide the BidAsk label in the OHLC window
- Select or clear the DisplayOnAxis check box to show or hide the BidAsk label on the vertical axis of the chart
K. Set Cross Hair Cursor
1. In the Cross Hair Cursor section,
- double-click the Color box, click a color, and then click OK;
- click the cross hair cursor style you want to set in the Style menu;
- select or clear the Sync on View check box to sync or unsync.
2. In the Value Label subsection,
- select or clear the Display check box to show or hide the value label;
- double-click the color box for Text Color, click a color, and then click OK;
- double-click the color box for Background Color, click a color, and then click OK.
3. In the Customization window, click OK.
4. The cross hair cursor is set.
L. Set Horizontal Axis
1. In the Horizontal Axis section, double-click the color box, click a color, and then click OK.
2. In the Value Label subsection,
- select or clear the Display check box to show or hide the value label;
- double-click the color box for Text Color, click a color, and then click OK;
- double-click the color box for Background Color, click a color, and then click OK.
3. In the Customization window, click OK.
4. The horizontal axis is set.
Font
Use the Font window to set the overall font for the Chart Window.
1. Click the Font sub-tab.
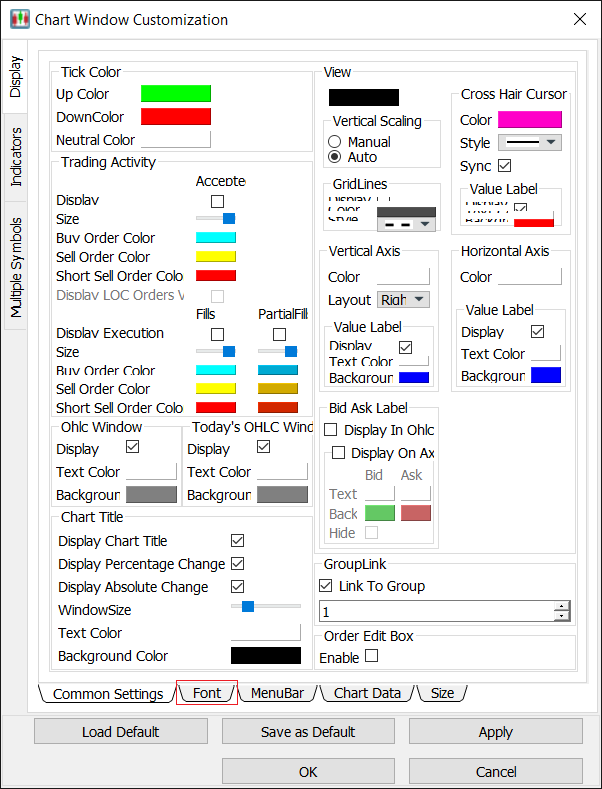
2. The Font window appears.
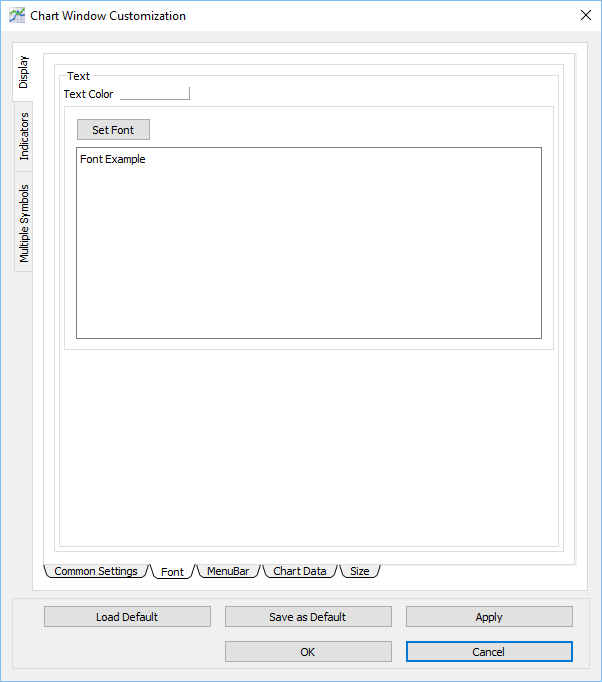
Set a font for the Chart Window
1. In the Font window, double-click the color box for Text Color, click a color, and then click OK.
2. Click Set Font….
3. The Select Font window appears.
4. Click the font, font style, size, effects, and writing system you want to set.
5. Click OK.
6. In the Customization window, click OK.
7. The font is set.
Menu Bar
Use the Menu Bar window to show or hide icons from the menu bar in the Chart Window.
1. Click the Menu Bar sub-tab.
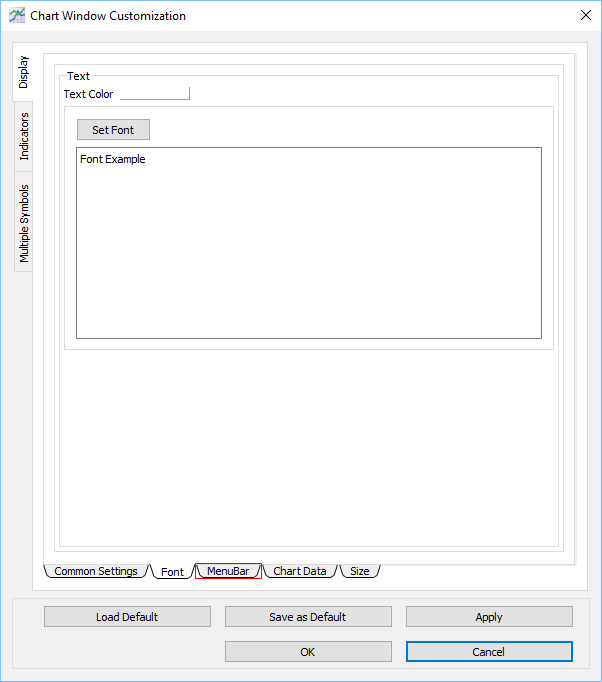
2. The Menu Bar window appears.
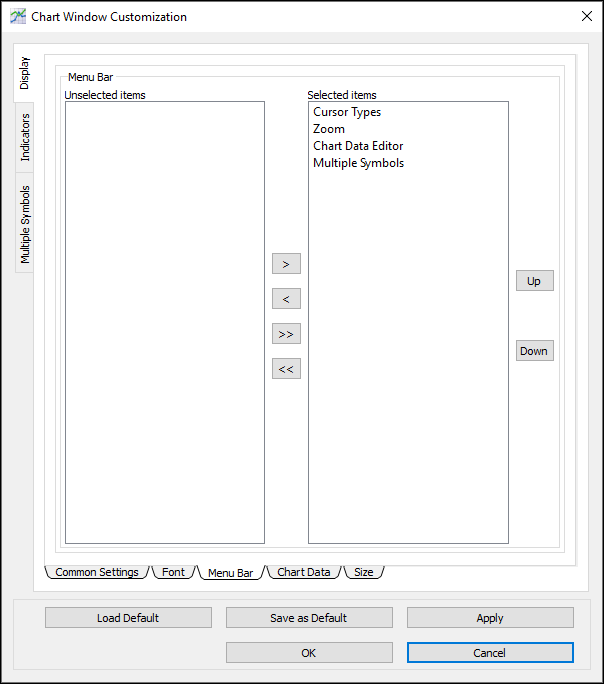
Show an item in the Chart Window
1. In the Menu Bar window, click an item in the Unselected items window.
2. Click the right arrow to move the item to the Selected items list.
3. In the Customization window, click OK.
4. The item appears in the Chart Window.
Hide an item from the Chart Window
1. In the Menu Bar window, click an item in the Selected items list.
2. Click the left arrow to move the item to the Unselected items list.
3. In the Customization window, click OK.
4. The item is hidden from the Chart Window.
Chart Data
Use the Chart Data window to clear data from the Chart Window, and to hide or display weekend and holiday data.
1. Click the Chart Data sub-tab.
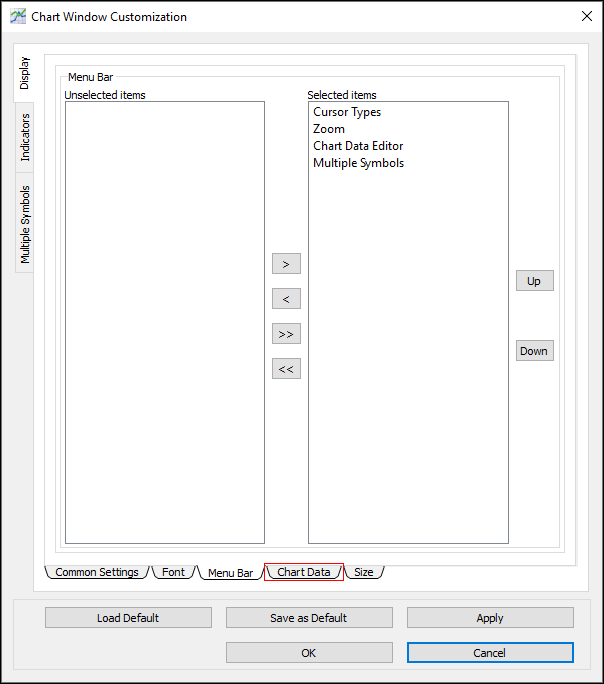
2. The Chart Data window appears.
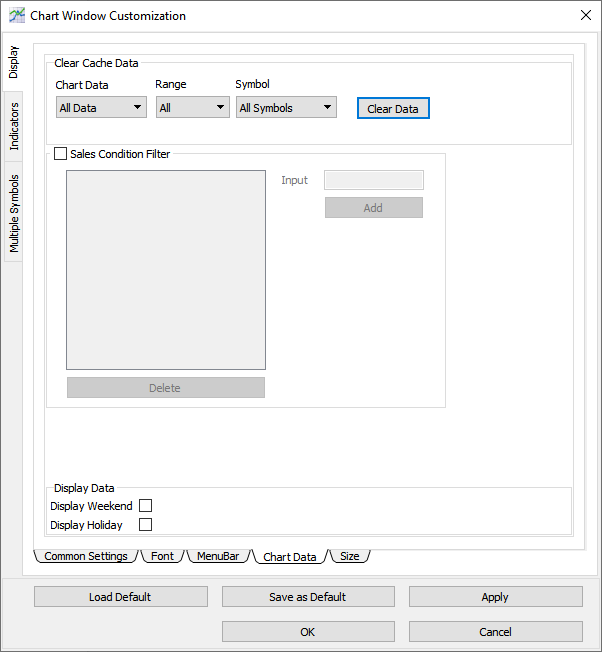
Clear cache data
1. In the Chart Data window, click the Chart Data menu, and then click an option (either All Data, Minute Data, or Day Data).
2. Click the Range menu, and then click All or Today.
3. Click the Symbol menu, and then click All Symbols or Current Symbol.
4. Click Clear Data.
5. The cache data is cleared.
Set a sales condition filter
1. In the Chart Data window, select the check box for Sales Condition Filter.
2. In the Input field, type a sales condition value, and then click Add.
Note: you can find available sales condition values in the TOS Values PDF on the Knowledge Base.
3. Click OK.
4. The filter is applied to the Chart Window, and the sales condition is hidden from view.
5. To remove a sales condition filter, in the Chart Data window, click the filter to select it, click Delete, and then click OK.
Show or hide weekend and holiday data
1. In the Chart Data window, select or clear the checkboxes for the Display Weekend and the Display Holiday options to show or hide weekend and holiday data in the Chart Window.
2. In the Customization window, click OK.
3. The chart data is updated.
Size
Use the Size window to configure default shares, maximum position, maximum order size, lot size overrides, and multipliers.
1. Click the Size sub-tab.
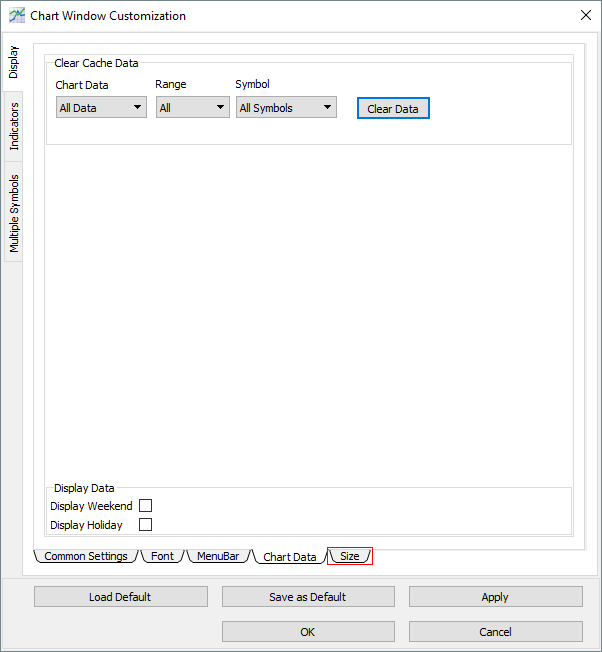
2. The Size window appears.
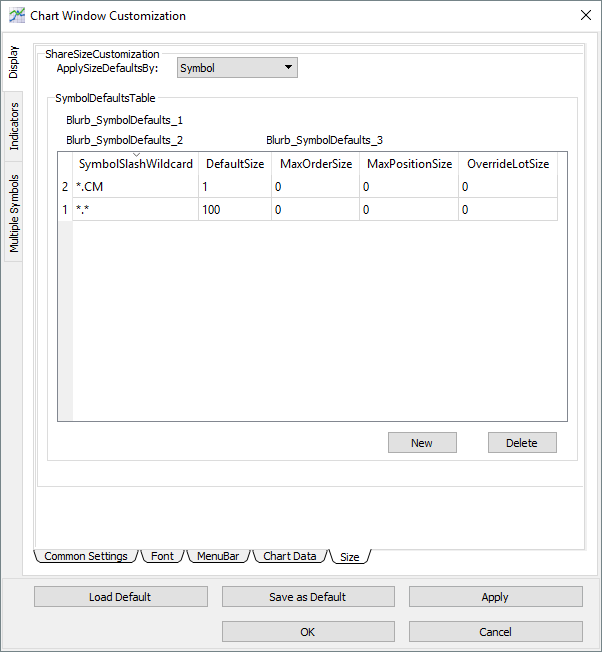
Apply size defaults by symbol
1. Ensure that the ApplySizeDefaultsBy option is set to Symbol.
2. Click the New button.
3. The AddNewSizeDefaultsBySymbol window appears.
4. Type the corresponding values in the EnterSymbolOrWildcard, DefaultShareSize, MaxOrderSize, MaxPositionSize, and DefaultLotSize fields.
5. Click OK.
6. The row is added to the table.
7. Continue adding symbols as needed.
8. In the Size window, click OK.
9. The size defaults are set for the symbol(s) when sending orders from the Chart Window.
Apply size defaults by window
1. Ensure that the ApplySizeDefaultsBy option is set to Window.
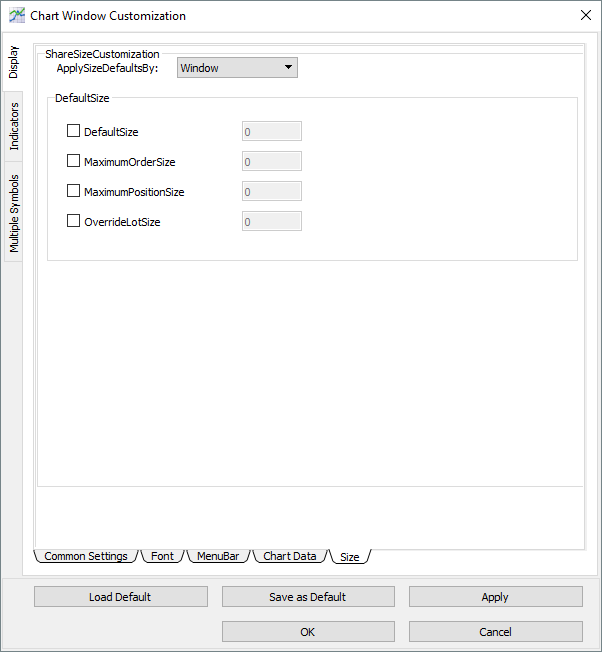
2. In the DefaultSize section, select or clear the check boxes and type values in the DefaultSize, MaximumOrderSize, MaximumPositionSize, and OverrideLotSize fields.
3. Click OK.
4. The size defaults are set when sending orders from the Chart Window.
Indicators
Use the Indicators window to adjust the indicator settings for the Chart Window.
- Click the Indicators tab to open the Indicators window.
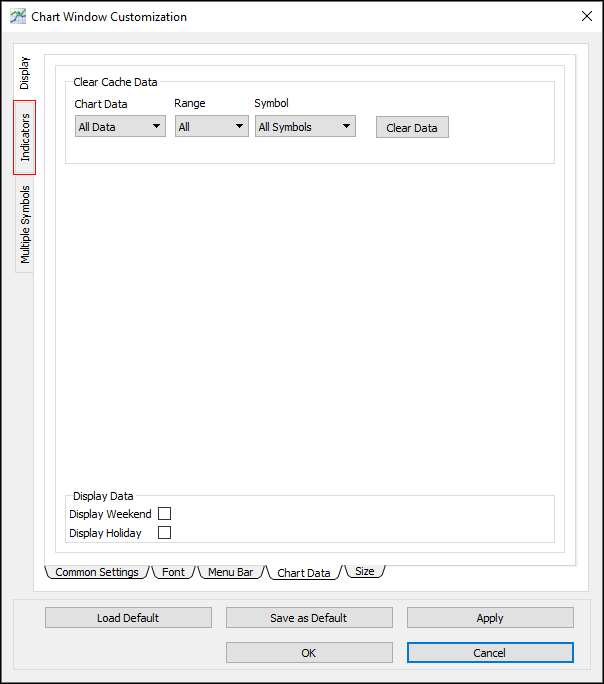
The Indicators window contains one sub-tab: Technical Indicators.
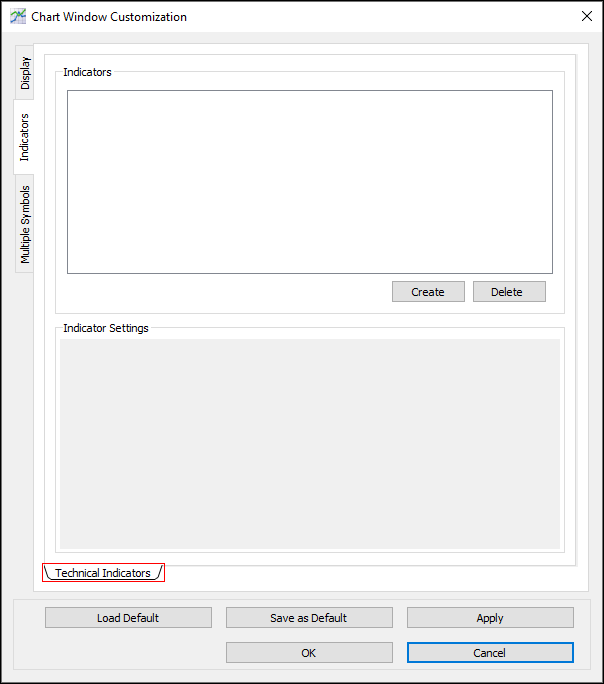
Technical Indicators
Use the Technical Indicators window to create, adjust, or delete technical indicators for the Chart Window.
Create a technical indicator
1. In the Technical Indicators window, click Create.
2. The Create New Indicator window appears.
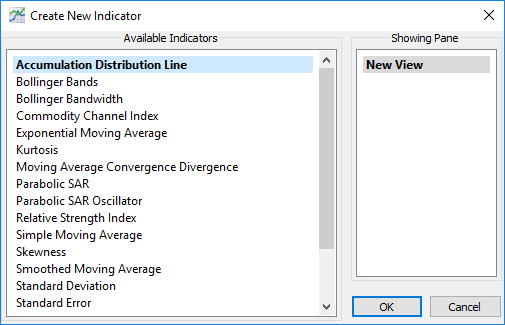
3. Click an indicator in the Available Indicators list.
4. Click OK.
5. The indicator appears in the Indicators section.
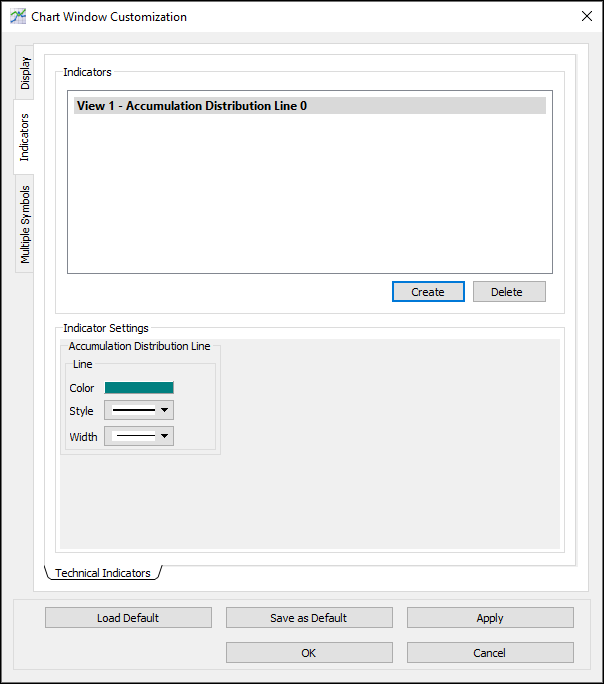
5. In the Indicator Settings section, type or click to adjust the indicator’s settings.
6. Click OK.
7. The indicator appears in the Chart Window.
Note: when setting up an indicator, you need to choose the View 0 option if you want to put the indicator on the chart itself, instead of below it.
Multiple Symbols
Use the Multiple Symbols window to add, remove, and compare multiple symbols from the Chart Window.
- Click the Multiple Symbols tab to open the Multiple Symbols window.
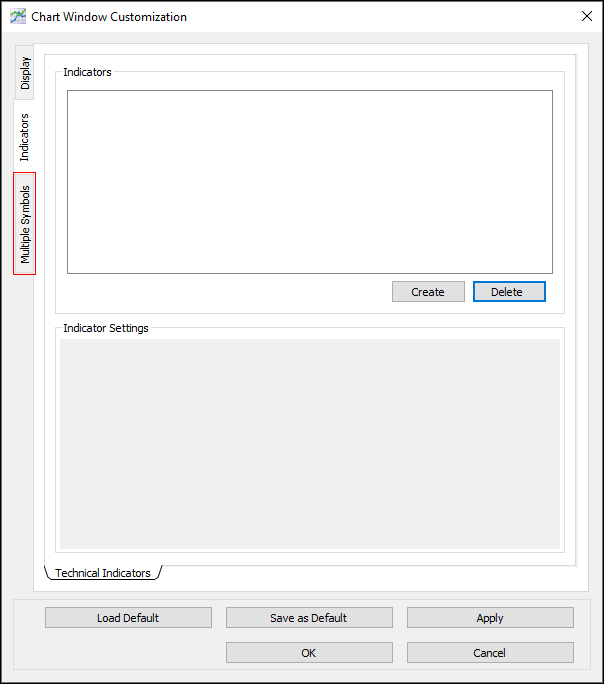
The Multiple Symbols window contains one sub-tab: Side by Side.
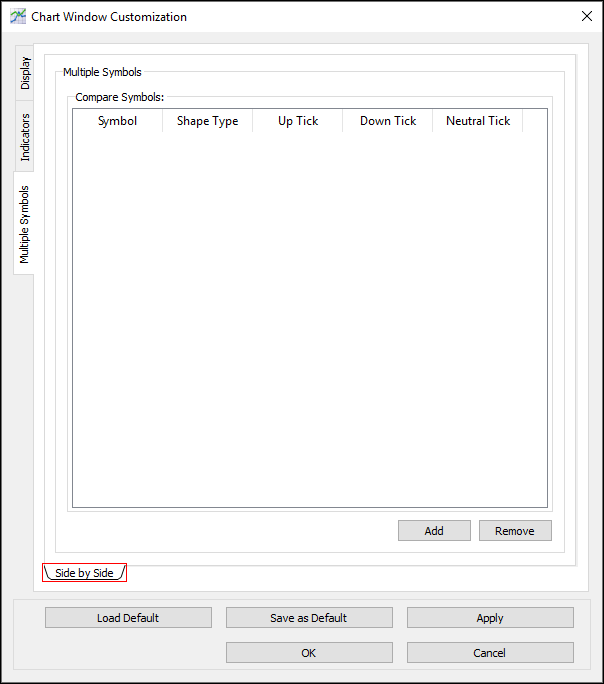
Side by Side
Use the Side by Side window to compare symbols, side by side, in the Chart Window.
Add a symbol for comparison
1. In the Side by Side window, click Add.
2. A row appears in the Compare Symbols table.
3. Double-click each cell in the row and type or click the symbol, shape type, up tick color, down tick color, and neutral tick color you want to set.
4. Click OK.
5. The symbol is added to the Chart Window for comparison.
Delete a symbol from comparison
1. In the Multiple Symbols window, click the row for the symbol you want to delete.
2. Click Remove.
3. Click OK.
4. The symbol is deleted from comparison in the Chart Window.
OHLC
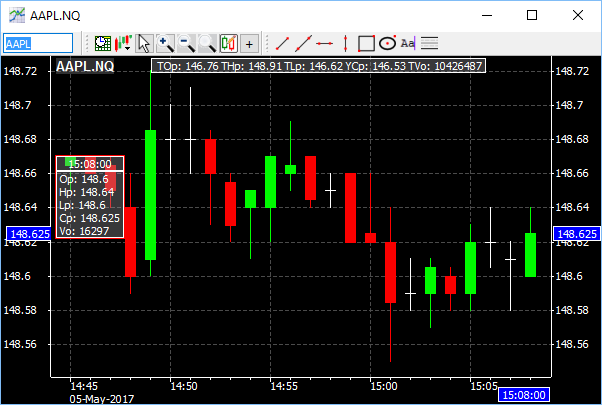
Use the OHLC window to show OHLC values for daily and time-specific values. The OHLC title bar shows daily values, and the OHLC window shows data points. To show or hide the OHLC window, select or clear the check box for the OHLC Window display option in Chart Window Customization: Display: Common Settings.
OHLC title bar
Use the OHLC title bar to view daily values, including:
- TOp = Today’s Opening price
- THp = Today’s High price
- TLp = Today’s Low price
- YCp = Yesterday’s Closing price
- TVo = Today’s Volume
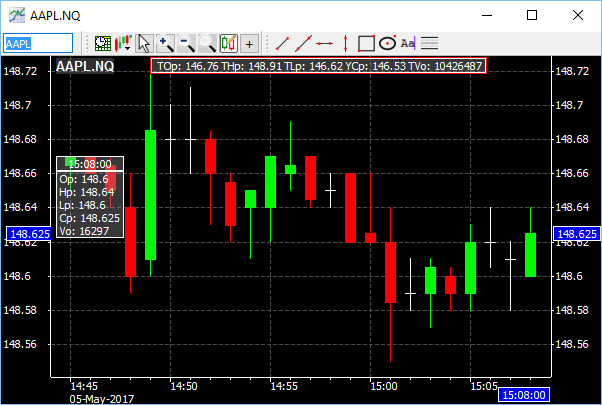
OHLC window
Use the OHLC window to view the last data point (candle) values, or any data point highlighted by the crosshair, including:
- Timestamp
- Op = Opening price
- Hp = High price
- Lp = Low price
- Cp = Closing price
- Vo = Volume
>Back to Top
Flattening Tool
The Flattening Tool can be used to flatten positions by market region, asset class, office, and trader. It sends an order to immediately close out one or more positions.
Note: Flattening is only available for manager accounts. Traders can flatten their own positions from Summary.
1. Click the red Flattening button.

2. The Flattening Tool appears.
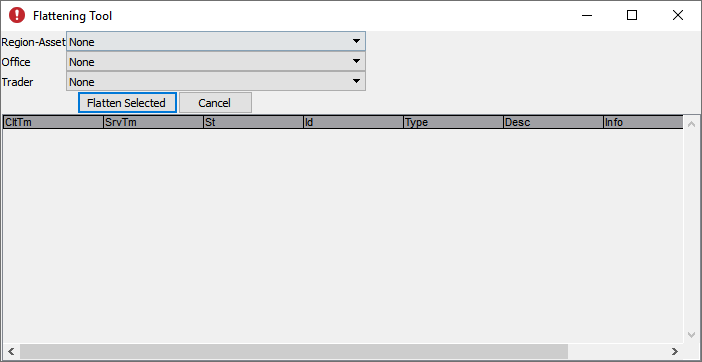
Columns:
- CltTime: Client Time
- SrvTm: Server Time
- St: Script State
- Id: Script ID
- Type: Script Type
- Desc: Script Description
- Info: Script Information
- OffId: Script Office ID
3. Select a region/asset class from the Region-Asset menu.
4. Select an office ID from the Office menu.
5. Select a trader ID from the Trader menu.
6. Select one or more position rows.
7. Click the Flatten Selected button.
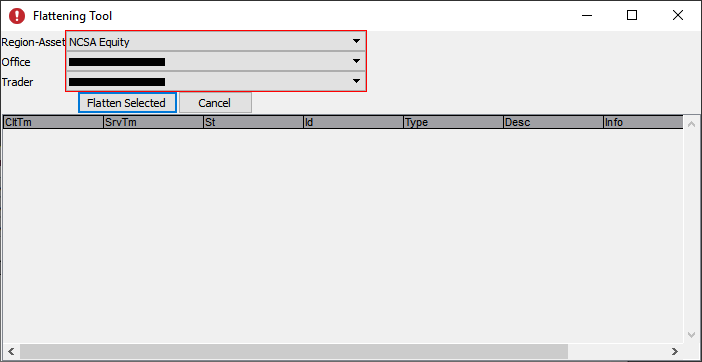
Note: position rows not pictured.
8. The selected positions get flattened.
9. You can click the Cancel button to cancel the flattening order before it reaches the market.
>Back to Top
PPro8 History Log
Use the PPro8 History Log window to look up order activities and trade history.
Open the History Log window
1. On the PPro8 toolbar, click HistoryLog.

2. The History Log window appears.
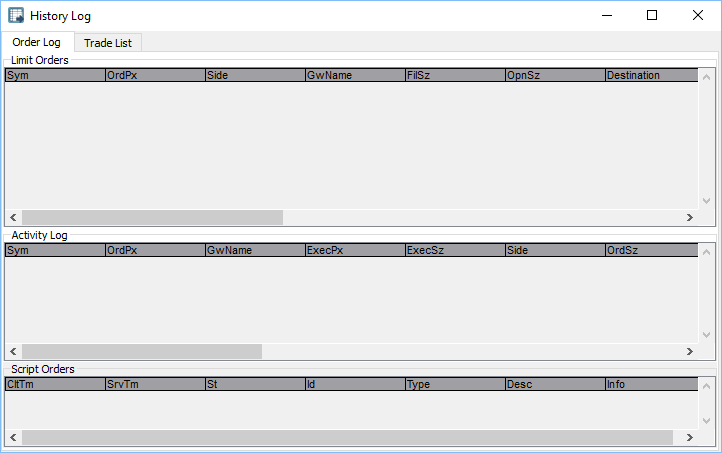
History Log window components
The History Log window contains two sub-tabs: Order Log and Trade List.
Order Log
Use the Order Log window to view the order log for orders placed on the current trade date.
- Right-click anywhere in the Order Log window, whether in the Limit Orders, Activity Log, or Script Orders section. The shortcut menu appears with the following options:
- Copy Cell to Clipboard: copy the content in any cell to clipboard.
- Copy Row to Clipboard: copy the selected row of data to clipboard.
- Order Log Customization Dialog: open the Order Log Customization window.
- Print Activity Log: print the activity log.
- Export Activity Log: export the activity log to CSV file format, which can then be imported in Excel for further review and analysis.
The Order Log window has three components: Limit Orders, Activity Log, and Script Orders.
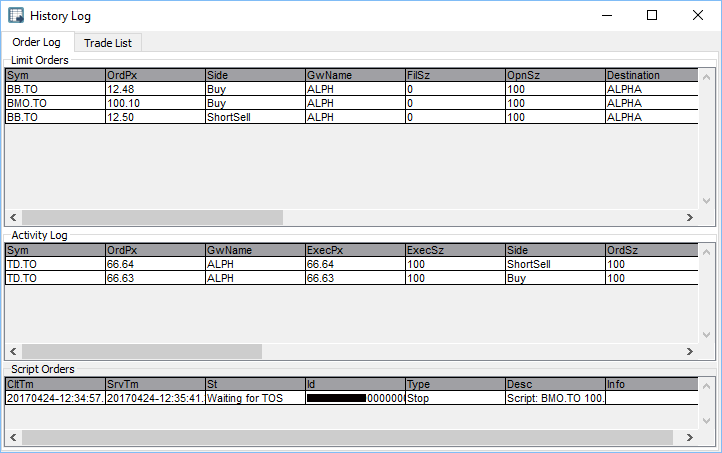
i. Limit Orders: view limit orders pending execution.
- Sym (Symbol): the symbol of the order
- OrdPx (Price Order): the accepted price of the order
- Side (Side Execution): the side of the order—either bid, offer, or short offer
- GwName (Gateway): the gateway where the order was sent
- FilSz (Size Filled): the number of shares the order was filled for
- OpnSz (Size Open): the order size currently accepted on the market
- Destination: the destination for the order
- OrdrSt (State): the current status of the order—accepted, pending, partially filled, or other
- MktTime (Market Time): the local market time when the order was sent
- LstEvnt (Last Event): the last event that happened to the order—accepted, rejected, canceled, or other
- OrdSz (Size Order): the order size sent to the market
- AutoCn (Auto Cancel): you can toggle whether or not to allow autocancel on filled or partially filled orders
- OrdrId (Order ID): the auto-generated order ID that uniquely identifies the order
- Market (Market Name): the name of the market where the order was sent
- ClntTime (Client Time): the time when the order was sent from the client
- Info (Information): other information about the order
- OrdCls (Order Class): the name of the order from Keyboard Setup
- ViaApi (Order sent via API): whether the order was sent via PProAPI—Yes or No
ii. Activity Log: view all order activities (orders sent, filled, partially filled, canceled, or rejected).
- Sym (Symbol): the symbol of the order
- OrdPx (Price Order): the price of the order
- GWName (Gateway): the gateway where the order was sent
- ExecPx (Price Execution): the price at which the order was executed
- ExecSz (Size Execution): the size at which the order was executed
- Side (Side Execution): the side at which the order was executed
- OrdSz (Size Order): the order size on the market
- FilSz (Size Filled): the number of shares the order was filled for
- OpnSz (Size Open): the order size currently accepted on the market
- OrdrSt (State): the state of the order
- LstEvnt (Last Event): the last event that happened to the order—accepted, rejected, canceled, or other
- Destination: the destination for the order
- Market (Market Name): the name of the market for the order
- MktTime (Market Time): the local market time of the order
- ClntTime (Client Time): the time of the order in the client
- OrdrId (Order ID): the auto-generated order ID that uniquely identifies the order
- Info (Information): other information about the order, such as liquidity flags and tags
- OrdCls (Order Class): the name of the order from Keyboard Setup
- ViaApi: ViaApi (Order sent via API): whether the order was sent via PProAPI—Yes or No
iii. Script Orders: view all script order activities.
- CltTime (Client Time): the time of the script order on the client side
- SrvTm (Server Time): the time of the script order at the script server
- St (State): the current status of the script order—accepted, pending, partially filled, or other
- Id (ScriptID): the auto-generated script order ID that uniquely identifies the order
- Type (Script Type): the type of script order—stop, flatten, cancel, or other
- Desc (Description): descriptive information about the script order
- Info (Script Info): other information about the script order, such as whether is was run successfully
- OffId (Office ID): the office ID where the script order originated
Trade List
Use the Trade List window to view trade execution history for the current trade date.
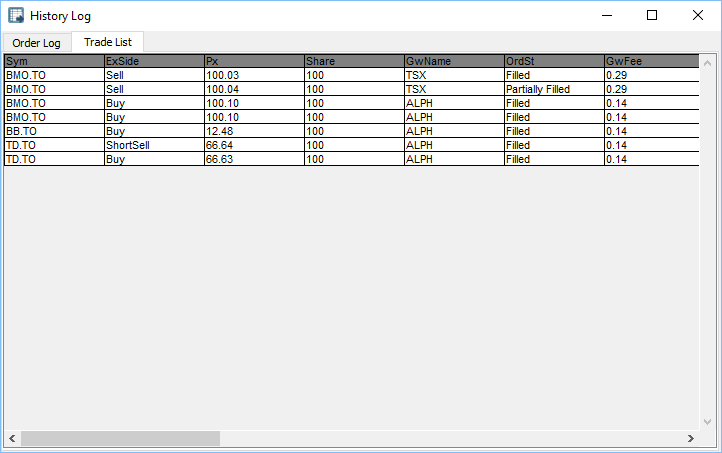
- Sym (Symbol): the symbol of the trade
- ExSide (Side): the side of the trade
- Px (Price): the price of the trade
- Share: the number of shares
- GwName (Gateway): the name of the gateway
- OrdSt (State): the state of the trade
- GwFee (Gateway Fee): the gateway fee
- ActFee (Activity Fee): the activity fee
- ExecFee (Execution Fee): the execution fee
- ClrFee (Clearing Fee): the clearing fee
- Time (Execution Time): the execution time of the trade
- Order# (Order Id): the auto-generated order number that uniquely identifies the trade (same as Order ID)
- LiqFlag (Liquidity Flag): the liquidity flag and tags
- GrossPL (Gross): the gross Profit and Loss
- NetPnL (Net): the net Profit and Loss
- PerPL (Net Per Share): Profit and Loss per share
- RegFee (Regulatory Fees): the regulatory fees
- Mkt (Market): the market
- Rg (Region): the region
- Destination: the destination
- ExDate (Date): the date of execution
- Info (Information): other information about the order, such as liquidity flags and tags
- Cy (Currency): the currency
Note: the foreground and background colors in each row are customizable for all order states: Buy, Sell, Short Sell, Reject, Cancel, and Error.
Note: orders rejected by PPro8 due to pre-trade checks appear as errors.
Use Cancel Replace function
Use this function to maintain your current limit order's price and time priority, while you have an opportunity to reduce its size.
Note: before you can use this function, your order must first be accepted.
1. Click a row in the Limit Orders section to select it, right-click the row to open the shortcut menu, and then click Cancel Replace. Or, click a row, and then press Ctrl + R.
2. The Cancel Replace window appears.

3. Type or click the replace size, and then click OK.
Note: it is only possible to set a smaller replace size (lower number of shares). The order number cannot be edited, and it is not possible to reduce below Lot Size value.
4. The cancel replace order is sent.
Use Cancel and Send New Order function
Use this function to modify all aspects of the order while it loses price and time priority. This creates an entirely new order.
1. Click a row in the Limit Orders section to select it, right-click the row to open the shortcut menu, and then click Cancel and Send New Order. Or, click a row, and then press Ctrl + N.
2. The floating Order Edit Box appears.

Note: the window title includes the symbol name, function (in this case, canceling), and order number for your reference.
3. Type or click the parameters (Gateway, Side, Destination, Order Type, Reference Side, Limit Price, Shares, TIF, Reserve, Display Size, and Minimum Size) you want to set for the new order.
4. Click Execute, or press Enter.
5. The original order is canceled and the new order is sent.
New: the Cancel and Send New Order dialog can use key shave values from Keyboard Setup to increase or decrease price and size. Simply click in the Limit Price or the Shares field, and then press the Up or Down key.
Set AutoCancel options
Use the AutoCancel options to automatically cancel parallel orders on a symbol when the order gets filled.
1. Click a row in the Limit Orders section to select it.
2. Right-click the row to open the shortcut menu.
3. Click Set AutoCancel on Fill to automatically cancel parallel orders on a symbol when the order is filled. Or, click a row, and then press Ctrl + 1.
4. Click Set AutoCancel on PartialFill to automatically cancel parallel orders on a symbol when the order is partially filled. Or, click a row, and then press Ctrl + 2.
5. Click Set AutoCancel off to turn off automatic cancels. Or, click a row, and then press Ctrl + 3.
6. The AutoCancel options are set.
History Log Customization
Order Log Customization
To make changes to the Order Log settings, right-click anywhere in the blank space of the Order Log, and then click Order Log Customization Dialog or press Ctrl + O, to open the Order Log Customization window. This window displays four tabs on the left: Options, Columns, Colors, Fonts, and Sounds.
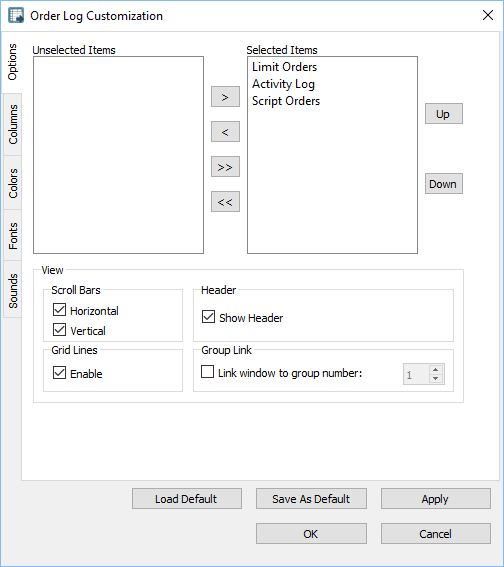
Options
Use the Options window to set the options for the Order Log.
- Click the Options tab to open the Options window.
Hide an item from the Order Log
1. In the Options window, click an item in the Selected items list.
2. Click the left arrow to move the item to the Unselected items list.
3. Click OK.
4. The item is hidden from the Order Log.
Show an item in the Order Log
1. In the Options window, click an item in the Unselected items list.
2. Click the right arrow to move the item to the Selected items list.
3. Click OK.
4. The item appears in the Order Log.
Hide Scroll Bars, Grid Lines, or Header
1. In the Options window, clear the check box(es) for the Scroll Bars, Grid Lines, or Header option.
2. Click OK.
3. The item(s) are hidden from the Order Log.
Show Scroll Bars, Grid Lines, or Header
1. In the Options window, select the check box(es) for the Scroll Bars, Grid Lines, or Header option.
2. Click OK.
3. The item(s) appear in the Order Log.
Link History Log to group number
1. In the Options window, select the check box for the Link window to group number option.
2. In the value field, type or click a number.
3. Click OK.
4. The History Log is linked to a group of windows by number.
Columns
Use the Columns window to manage the columns that appear in the Limit Orders, Activity Log, and Script Order windows.
- Click the Columns tab to open the Columns window.
Limit Orders columns
Use the Limit Orders columns window to set the order in which limit order items appear in the Order Log.
1. Click an item in the Selected items list.
2. Click Up or Down.
3. Click OK.
4. The item is moved in the Limit Orders section.
Activity Log columns
Use the Activity Log columns window to set the order in which activity log items appear in the Order Log.
1. Click an item in the Selected items list.
2. Click Up or Down.
3. Click OK.
4. The item is moved in the Activity Log section.
Script Orders columns
Use the Script Orders columns window to set the order in which script order items appear in the Order Log.
1. Click an item in the Selected Items list.
2. Click Up or Down.
3. Click OK.
4. The item is moved in the Script Orders section.
Colors
Use the Colors window to set the colors for gateways and pending symbols in the Order Log.
- Click the Colors tab to open the Colors window.
Gateway Colors
Use the Gateway Colors section to set the background and foreground colors for the various gateways and order states.
1. In the Colors window, under Gateway Colors, click a gateway.
2. Double-click a color box.
3. The Color Selector window appears. Click a color, and then click OK.
4. The color is set for the gateway and order status.
Partial Fill Colors
- Select the Color Partial Filled check box to color partial fills.
Fonts
Use the Fonts window to set the overall font for the Order Log.
- Click the Fonts tab to open the Fonts window.
Set a font for the Order Log
1. In the Fonts window, click Set Font.
2. The Select Font window appears.
3. Click the font, font styles, size, effects, and writing system you want to set.
4. Click OK.
5. In the Order Log Customization window, click OK.
6. The new font is set.
Sounds
Use the Sounds window to set a sound alert for fills by symbol.
- Click the Sounds tab to open the SoundsConfiguration window.
Set a sound alert for a symbol
1. In the SoundsConfiguration window, click New.
2. A new row appears.
3. Type a symbol, click a trigger type (On Fill or On Part Fill), and select a sound file.
Note: to set a sound alert for all symbols, type *.* in the symbol field. To set a sound alert for a market, e.g., Nasdaq, type *.NQ.
4. Click OK.
5. The sound alert for the symbol is set.
Trade List Customization
To make changes to the Trade List settings, right-click anywhere in the blank space of the Trade List, and then click Trade List Customization Dialog or press Ctrl + T, to open the Trade List Customization window. This window displays four tabs on the left: Options, Columns, Colors, and Fonts.
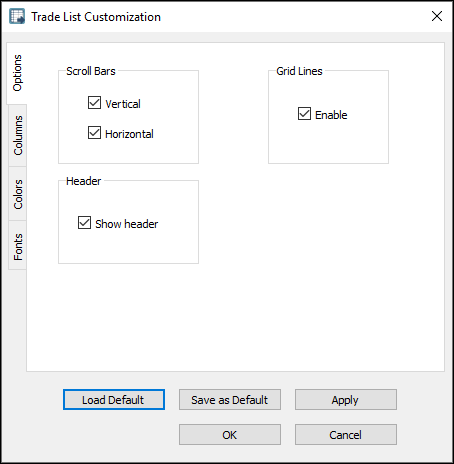
Options
Use the Options window to set the options for the Trade List.
- Click the Options tab to open the Options window.
Hide an item from the Trade List
1. In the Options window, clear the check box for an item that appears in the Trade List.
2. Click OK.
3. The item is hidden from the Trade List.
Show an item in the Trade List
1. In the Options window, select the check box for an item that is hidden from the Trade List.
2. Click OK.
3. The item appears in the Trade List.
Columns
Use the Columns window to manage the columns that appear in the Trade List.
- Click the Columns tab to open the Columns window.
Hide a column from the Trade List
1. Click an item in the Selected items list.
2. Click the left arrow to move the item to the Unselected items list.
3. Click OK.
4. The column is hidden from the Trade List.
Show a column in the Trade List
1. Click an item in the Unselected items list.
2. Click the right arrow to move the item to the Selected items list.
3. The column appears in the Trade List.
Colors
Use the Colors window to set the foreground, background, gridline, and Header colors for the Trade List.
- Click the Colors tab to open the Colors window.
1. In the Colors window, double-click a color box.
2. The Color selector window appears. Click a color, and then click OK.
3. The color for the Trade List is set.
Fonts
Use the Fonts window to set the overall font for the Trade List.
- Click the Fonts tab to open the Fonts window.
Set a font for the Trade List
1. In the Fonts window, click Set Font.
2. The Select Font window appears.
3. Click the font, font styles, size, effects, and writing system you want to set.
4. Click OK.
5. In the Trade List Customization window, click OK.
6. The new font is set.
Alignment Editor and Filter Option
Use the Alignment Editor and Filter Option to align columns to the left, center, or right, and to set a filter for the History Log window.
Align a column and activate a filter in the History Log window
1. Right-click a column heading, such as Symbol, MarketName, PriceOrder, Side, State, SizeOrder, SizeFilled, SizeOpen, Gateway, Destination, AutoCancel, OrderID or ViaApi in the Limit Orders section, or ClientTime, ServerTime, State, ScriptID, or ScriptType in the Script Order section of the History Log window.
2. The Alignment Editor and Filter Option appear.
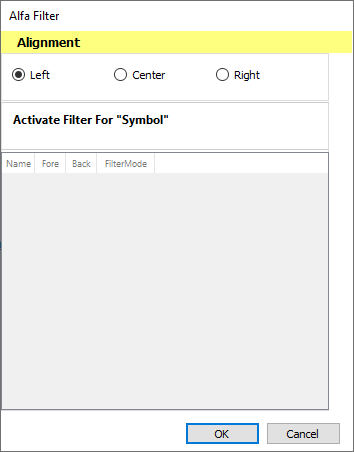
3. In the Alignment section, click Left, Center, or Right to align the column left, center, or right.
4. Click Activate filter for Symbol to set the filter option.
5. Click a filter parameter option, type a value or values, and double-click the color boxes to set colors for the filter.
6. Click OK.
7. The column is aligned and the filter is activated for the column.
>Back to Top
PPro8 Imbalance Locator
Use the PPro8 Imbalance Locator to see imbalance shares during a market’s opening and closing auctions.
Open the Imbalance Locator
1. On the PPro8 toolbar, click ImbalanceLocator.

2. The Imbalance Locator appears.
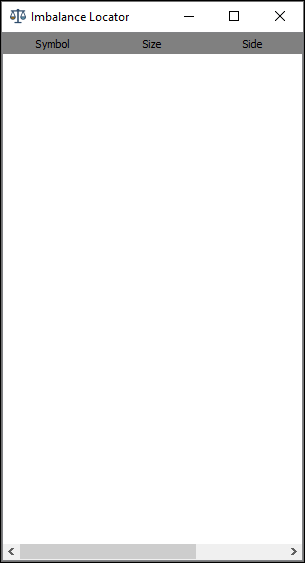
Imbalance Locator columns

- Symbol: the symbol name
- Size: the size of the imbalance shares
- Side: the side of the imbalance shares, B (Buy), S (Sell), or N (Neutral)
- Auction Price: the price for the auction
- Continuous Price: the price for continuous trading
- Continuous Price * Size: the price for continuous trading multiplied by share size
- Market Time: the time at the market
- Pair Volume: the number of shares already executed during the auction
- Price: the price of the imbalance shares
- Source: the source of the imbalance share data
- Status: the status of the symbol
- Type: the type of auction: M or O (Market Open), H (Halted), or C (Market Close)
Imbalance Locator Customization
To make changes to the Imbalance Locator settings, right-click in the Imbalance Locator to open the Imbalance Locator Customization. This window displays four main tabs on the left: Filters, Columns, Colors, and Font.
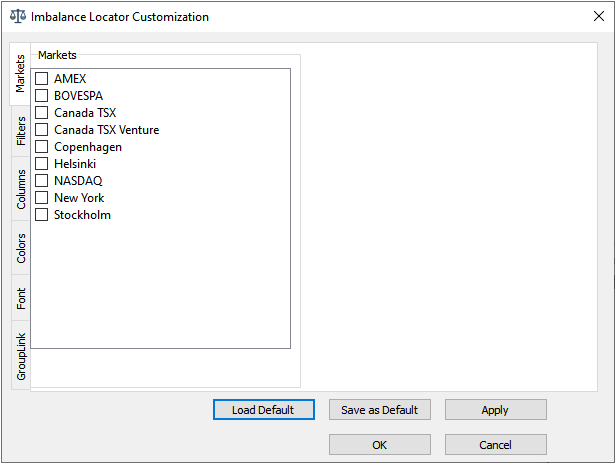
Filters
Use the Filters window to filter imbalance shares by market or symbol list.
- Click the Filters tab to open the Filters window.
Filter and toggle imbalance shares
1. In the Filters window, select or clear the check box for each market or symbol list you want to display or hide imbalance data for.
2. Click Toggle Selection to switch between selections, i.e., select previously cleared check boxes and clear previously selected check boxes.
3. Click OK.
4. The filtered imbalance data appear.
Columns
Use the Columns window to manage columns that appear in the Imbalance Locator.
- Click the Columns tab to open the Columns window.
Show a column in the Imbalance Locator
1. In the Columns window, click an item in the Unselected Items list.
2. Click the right arrow to move the item to the Selected Items list.
3. Click OK.
4. The column appears in the Imbalance Locator window.
Hide a column in the Imbalance Locator
1. In the Columns window, click an item in the Selected Items list.
2. Click the left arrow to move the item to the Unselected Items list.
3. Click OK.
4. The column is hidden from the Imbalance Locator window.
Colors
Use the Colors window to set the colors for the header, grid line, and rows.
- Click the Colors tab to open the Colors window.
Set a color for the Imbalance Locator
1. In the Colors window, double-click a color box.
2. The Color Selector window appears. Click a color, and then click OK.
3. In the Colors window, click OK.
4. The color is set.
Font
Use the Font window to set the overall font for the Imbalance Locator.
- Click the Font tab to open the Font window.
Set a font for the Imbalance Locator
1. In the Font window, click Set Font.
2. The Select Font window appears.
3. Click the font, font style, size, effects, and writing system you want to set.
4. Click OK.
5. In the Customization window, click OK.
6. The font is set.
GroupLink
Use the GroupLink view to group the Imbalance Locator with other PPro8 tools.
- Click the GroupLink tab to open the GroupLink view.
Link the Imbalance Locator to a window group
1. In the GroupLink view, select the check box for the Link Window to Group Number option, and then click or type the window group number.
2. Click OK.
3. The group link is set.
>Back to Top
PPro8 Keyboard Setup
With the PPro8 Keyboard Setup, you can set up keyboard shortcuts for a single order, a list of orders, and scripted orders.
Open Keyboard Setup
1. On the PPro8 toolbar, click Keyboard Setup.

2. The Keyboard Setup window appears.
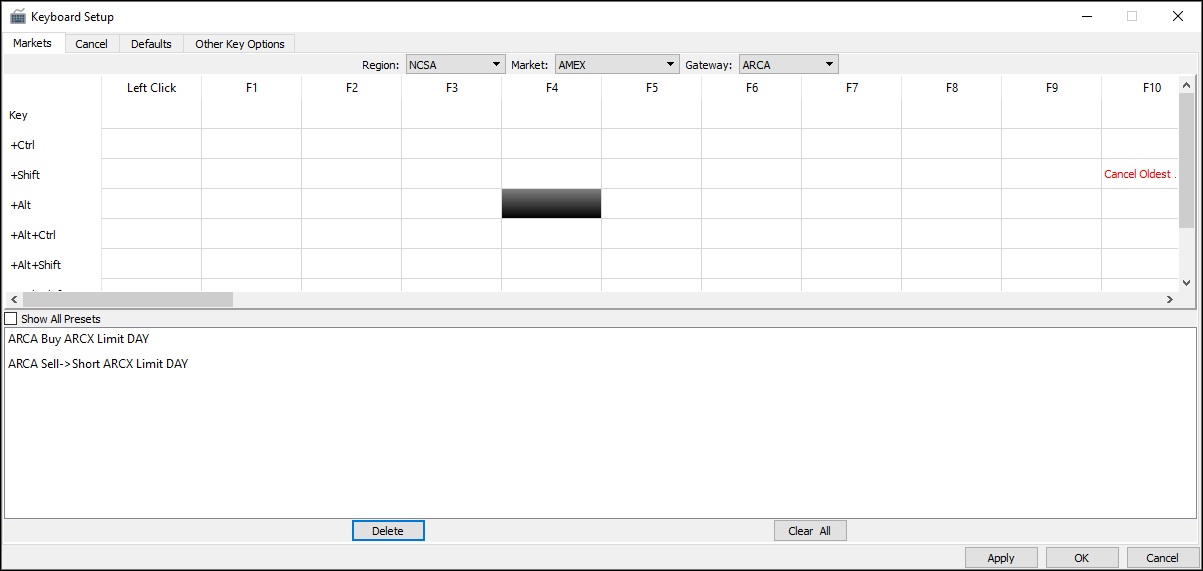
The Keyboard Setup window contains four tabs: Markets, Cancel, Defaults, and Other Key Options.
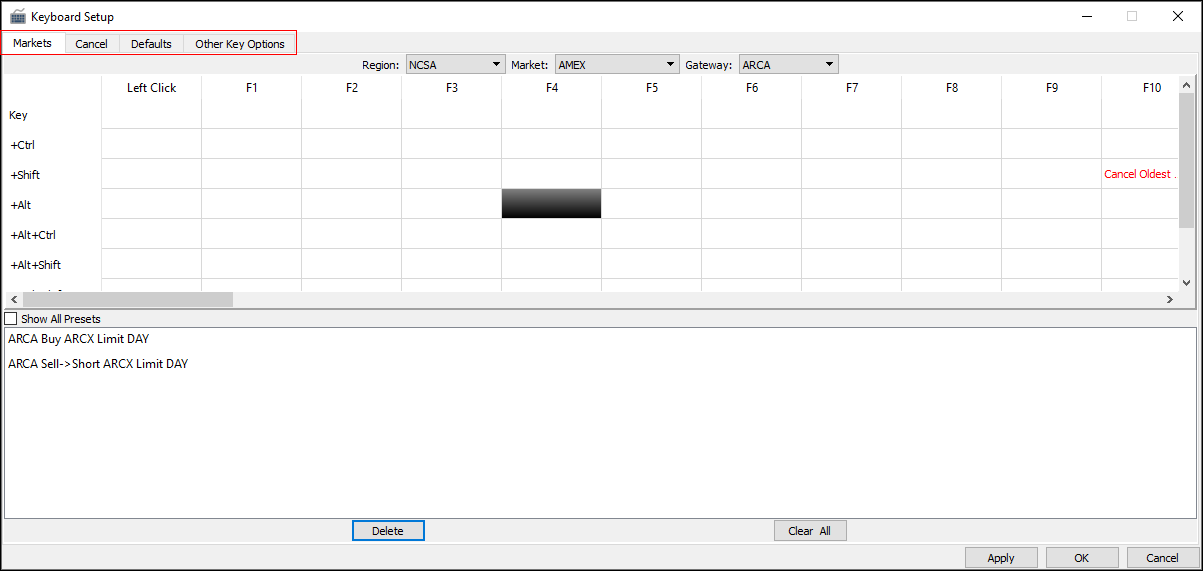
Markets
Use the Markets window to set up keyboard shortcuts for single orders, a list of orders, and script orders for each region and market you want to trade.
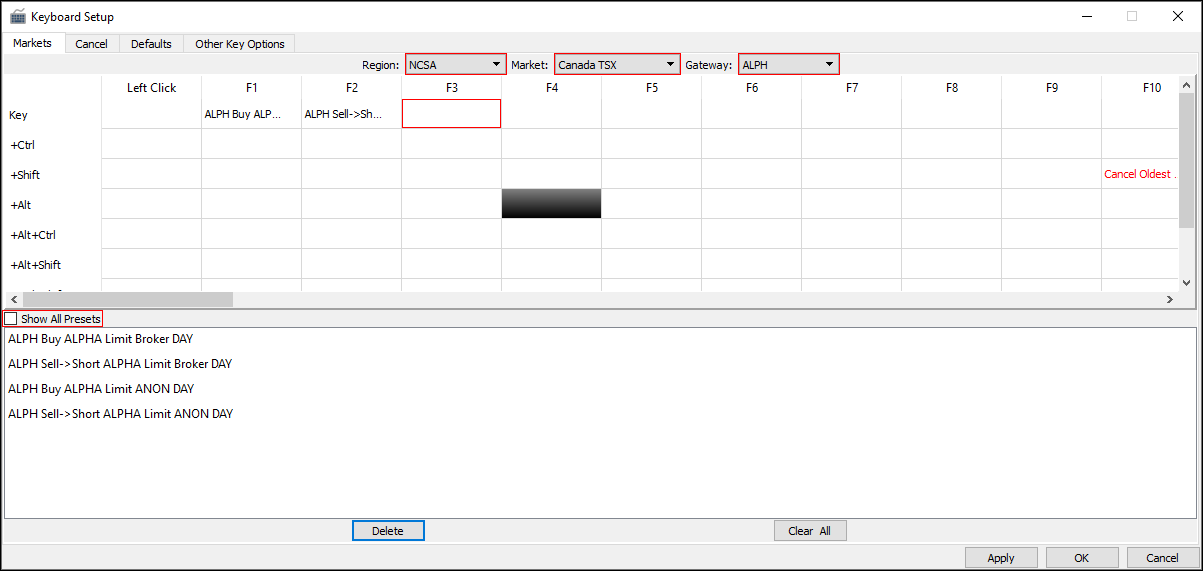
- Region: the region where the market is located
- Market: after you click the region, click the specific market where the keyboard shortcut applies
- Gateway: click the gateway you want to use for this keyboard shortcut
- Show All Presets: select or clear the check box to show Basic Presets or All Presets, and then click an item in the list to use a preset order type
- Order Setup Dialog: double-click a blank cell to open the order editor window

- Single order: click this option to set up a keyboard shortcut for a single order
- Order list: click this option to set up a keyboard shortcut for a list of predefined orders
- Script order: click this option to set up a keyboard shortcut for a scripted order
- Order Name: type a specific name for an order to identify it
- Show Order Edit Box: select this check box to show the order edit box when you click the keyboard shortcut
- Order configuration box: use this box to set the following order characteristics:
- Side: click Buy or Sell→Short
- Destination: click the market or exchange where the order is to be sent
- Order Type: automatically set to Limit
- Reference Side: click to set whether the order price follows the near or far side of the Level 1 quote
- Price Adjust: type a price adjustment amount for a Limit order type on the reference price
- TIF (Time in Force): click the TIF for the order, such as Day, IOC, GOC, or FOK
- Reserve: click to set whether to show the entire order size or a portion of the order size
- Display Size: if you click Yes in Reserve, you can then type the amount of the order size to be displayed in the lit market
- To save the new keyboard settings, click OK.
Set up Click-to-Trade function
You can set up the Click-to-Trade function for trading in the Stock Window using mouse clicks. To use this function, follows these steps.
Note: whatever you set as the left-click will be the buy or the sell instruction. If you click on the left side (bid) of the Stock Window, it will send a sell/short sell order. If you click on the right side (ask) of the Stock Window, it will send a buy order. The order can be sent at any price(s). It will execute as a market order if you send it at a more aggressive price.
1. In the Keyboard Setup window, click a Region, Market, and Gateway.
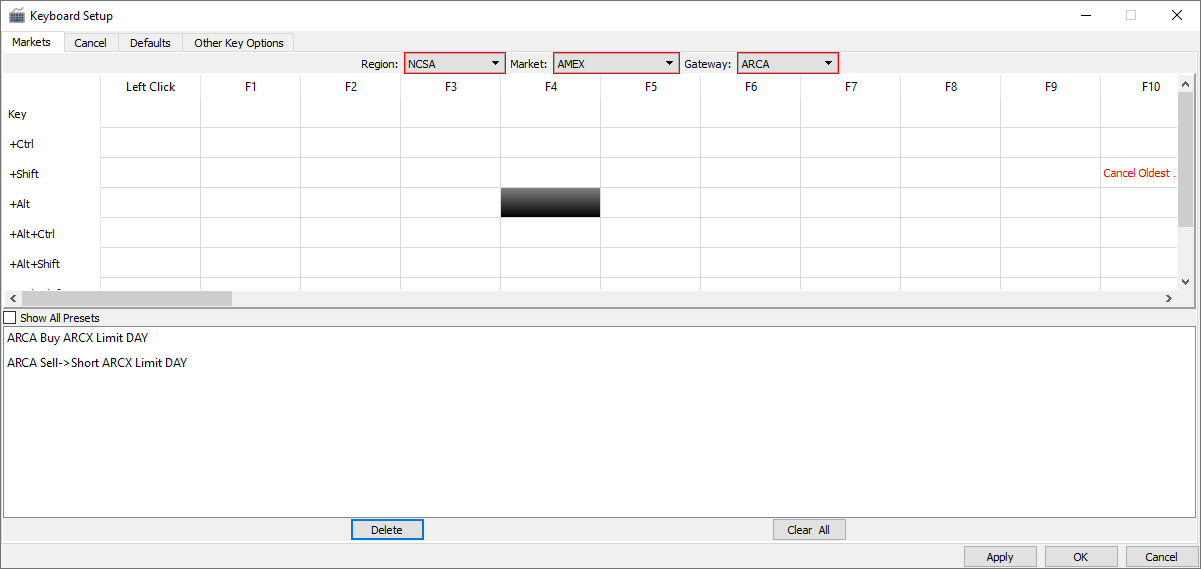
2. Double-click the Left Click cell.
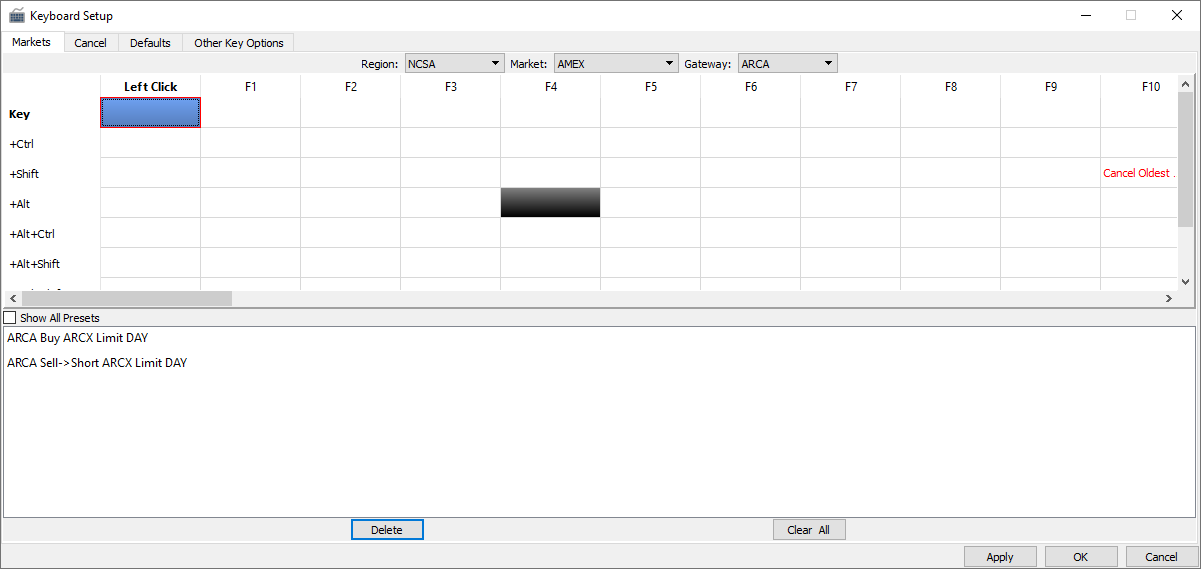
3. The Order Setup Dialog window appears.

4. Click or type values in the order fields, and then clear the check box for the Show Order Edit Box option.

5. Click OK.

6. In the Stock Window, left-click on the Price column in the Stock Window to set the order by price. Left-click on the Total column to set the order by size.
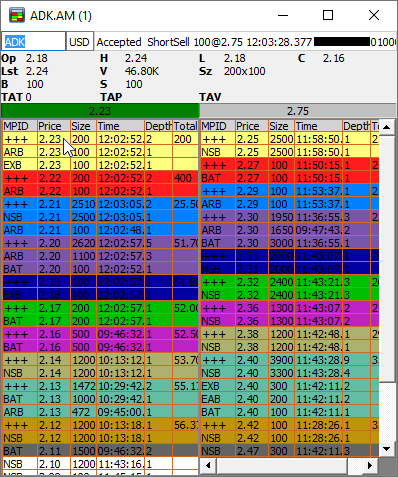
7. Press Enter.
8. The order is sent.
Stop/Conditional Orders
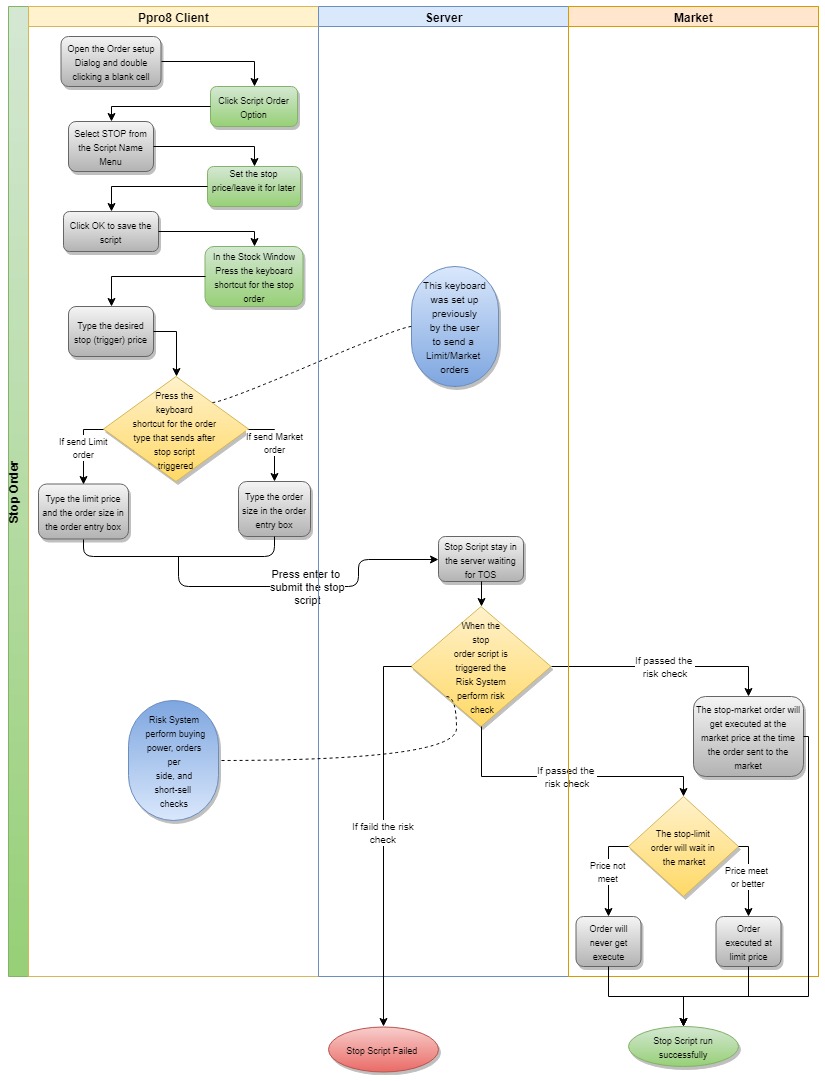
Warning: when using Script Stop/Trailing Stop orders, keep in mind that all risk checks (buying power, orders per side, short-sell) are performed at the time the order is triggered, NOT at the time it is entered.
Script orders are stop-loss orders. These orders are instructions to submit a buy or sell order if the user-specified stop trigger price is reached.
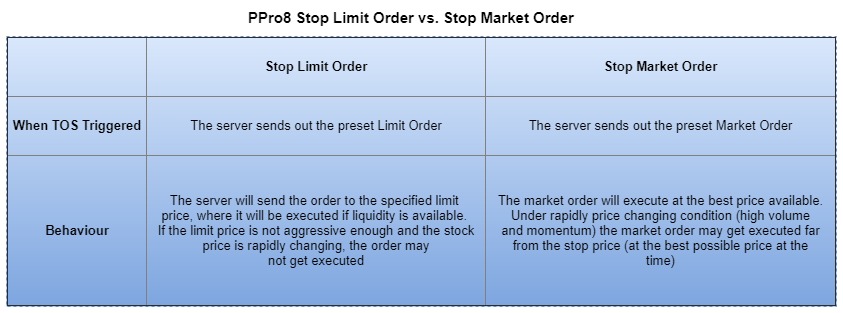
Set up a script order
1. Open the Order Setup Dialog window by double-clicking a blank cell.
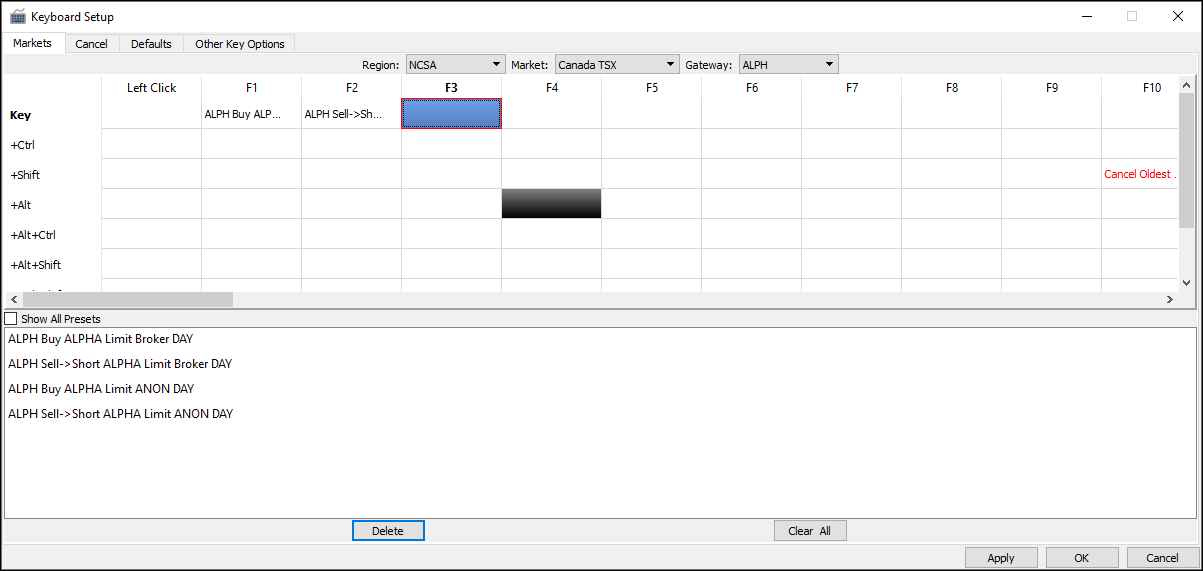
2. Click the Script Order option to open the script order edit window.

3. From the Script Name menu, if Stop is selected, the price can be set in the empty field or left blank (you can set the stop price later, when you send the order). You can also configure the Reference Price and Trigger Type settings.
If Trailing Stop is selected, Reference Price, Offset Type, and Increment Type can be chosen. The empty fields can be filled in or left blank (you can set the Trail Offset and Trail Increment values when you send the order as well).

4. Click OK to save the script.

A stop order stays in the server and becomes a marketable order when the stock price moves above (stop buy order) or under (stop sell order) the stop price. A trailing stop order also stays on the server and becomes a marketable order when “upfrombottom” or “downfromtop” exceeds the “trailing offset” amount.
New: there are now more options available for trailing stop orders in the Order Setup Dialog window, including:
- Reference Price
- Offset Type (Numeric, Percentage, Number of Ticks)
- Increment Type (None, Numeric, Percentage, Number of Ticks)
Send a stop order
1. In the Stock Window, press the keyboard shortcut for the stop order.
2. The stop price box appears below the quotes. Type the desired stop (trigger) price.
3. Press the keyboard shortcut for the order type necessary (Buy or Sell) when the stop price is reached.
4. In the limit box, type the limit price of the order you wish to execute upon the stop price being met.
5. Press Enter to submit the stop order. The order stays on the Script Server until the trigger price is reached, which will be identified by the Time of Sales, and then the pre-defined order is sent to the gateway.
For example, you have a long position of TD.TO at 54.26. You wish to exit if the stock drops to 54.19. In order to accomplish this, your stop price would be set to 54.19.
To exit the trade, your limit price would be set below 54.19, for example, 54.15. This will send an order to the market for 54.15 when the stop of 54.19 is met. A trader can set the limit further from the stop price to ensure the likelihood of a fill in the event of rapid price movement.
Send a trailing stop order
New: there are now more options available for trailing stop orders in the Order Setup Dialog window, including:
- Reference Price Options:
- This will allow the trader to specify what price they want to base the triggering event on. This provides greater control over the previous implementation where it was just LastPrice (last print on TOS), now they can also use the current Bid / Ask / Midpoint. Example: Reference Price is set to 'Ask' and for Offset Type, 'TickSize' is chosen. Symbol ABC, with tick size of 0.05, is at 35.05 Bid and 35.10 Ask. When entering a trailing stop order, the trader inputs a value of 4 into the tick offset, and the trailing stop would thus be 0.20 away from the Ask price.
- Offset Type:
- This will allow the trader to specify whether the offset is specified as a numeric, percentage, or number of ticks value. This gives traders greater flexibility when trading instruments with different tick sizes or pricing.
- Note: the offset specifies how far from the best price the price must move before triggering the trailing stop. Example: if the user is trading symbol ABC, and the Bid is at 80.00 at the time of the trailing stop entry, if the trader selects to place to a trailing stop at a 1% offset from the Bid price, then the trailing stop would be 0.80 away from the Bid price.
- Increment Type:
- This will allow the trader to specify (if desired) how far the security being traded must move before the trail amount (offset) adjusts itself. This value can be set to None (no increment) or as a numeric, percentage, or number of ticks value. For example: if stock ABC is trading at 80.00 and the user enters a trailing stop with a trail offset of 1.00 and a trailing increment of 0.25, the stop price would begin at 79.00. If the stock moved up to 80.20, the stop price will still be at 79.00. However, if the stock moves up to 80.25, then the stop price will adjust to 79.25.
1. In the Stock Window, press the keyboard shortcut for the trailing stop order.
2. The Trail Offset and Trail Increment boxes appear below the quotes.
3. Press the keyboard shortcut for the order type when the trigger price is reached. For example, if TD.TO (with a tick size of 0.01) is trading at 54.26 and you want to sell when it drops 0.27, use your ALPHA limit sell key and type a marketable limit price of 53.95 to ensure a fill.
4. Type the Trail Offset for the trailing stop order. For example, you want to send an ALPH limit order to sell 100 shares of TD.TO when the price has declined a certain amount (0.27 in this case). You would enter 0.27 for Trail Offset if you set it as Numeric, 0.5 if set as Percentage, or 27 if TickSize was chosen. These would all be based on LastPrice selected for Reference Price.
5. Enter the Trail Increment for the trailing stop order. In our example above, when the price rises you want the stop to only move in 0.05 increments, type 0.05 for Numeric, 0.1 if set as Percentage, or 5 if TickSize was chosen. If None was selected then the increment will be 1 tick.
6. Press Enter to submit the trailing stop order. The order stays on the Script Server until the trigger price of 0.27 below the Last Price when the order was sent or last increment move is reached, and then the predefined order is sent to the gateway.
Bracket Orders
Overview
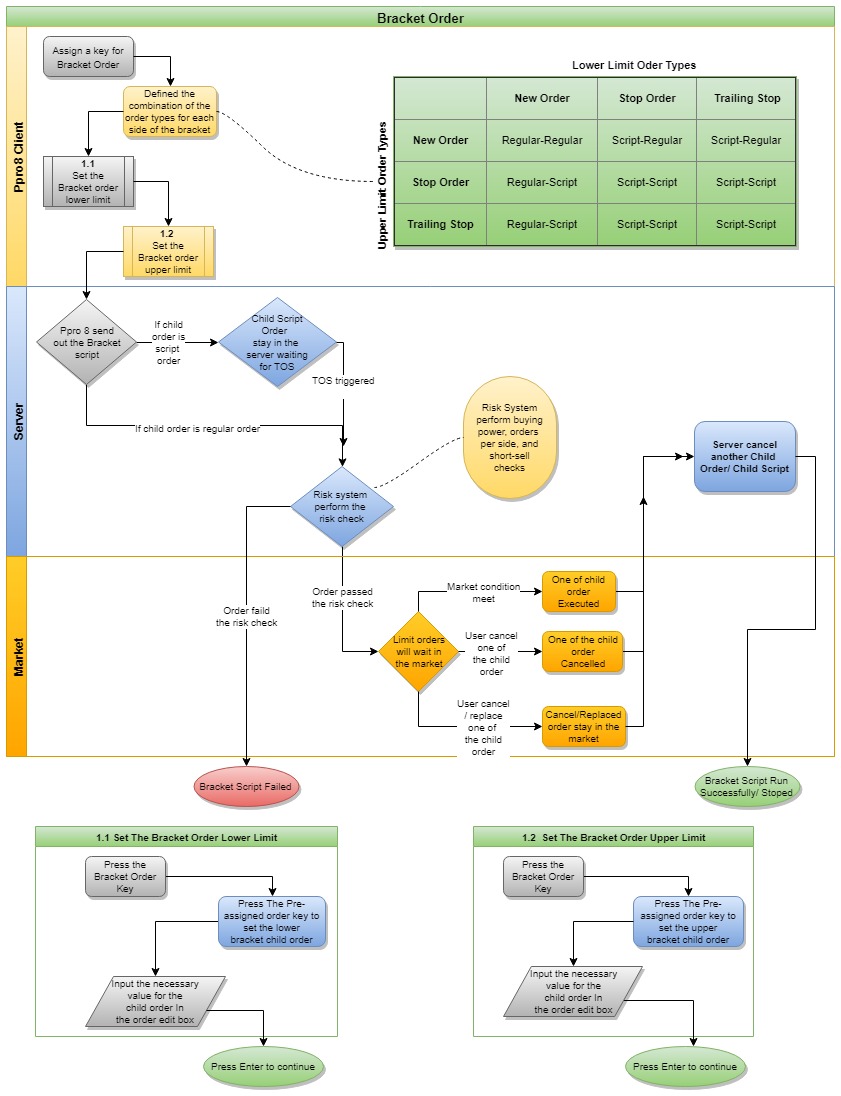
Bracket Orders are a script order type that can be used for entering new positions as well as managing existing positions. They are designed for limiting loss and locking in profit by placing a ‘bracket’ on an order, with two orders. For example, a buy order can be bracketed by a high-side sell order and a low-side sell stop order. You can set any combination of buy or sell orders within a bracket.
The naming convention for the two parts of the order is as follows:
- Bracket Low Limit (lower bracket) - where the user inputs desired order for the lower part of the bracket
- Bracket Up Limit (upper bracket) - where the user inputs desired order for the upper part of the bracket
Note: the two parts of the order are not named ‘stop-loss’ and ‘profit-taker’ because that would assume that the bracket is tied to an underlying position, which is not always the case.
There are nine bracket types (order combinations) to choose from, as follows:
upper: New Order | lower: New Order
upper: New Order | lower: Stop
upper: Stop | lower: New Order
upper: New Order | lower: Trailing Stop
upper: Trailing Stop | lower: New Order
upper: Stop | lower: Stop
upper: Stop | lower: Trailing Stop
upper: Trailing Stop | lower: Stop
upper: Trailing Stop | lower: Trailing Stop
Note: for the above order combinations, “New Order” refers to a normal order (Limit, Market, etc.) sent without a trigger price, i.e., not a stop order or a trailing stop order.
Note: when it is part of a bracket order, a stop order appears as “Swift Stop” in PPro8.
Configure a Bracket Order
1. In Keyboard Setup, double-click a blank cell to open the Order Setup Dialog window.

2. Click the Script Order option to open the script order edit window.

3. In the Script Name menu, click Bracket Order.

4. In the Bracket Low Limit menu, click an order type (New Order, Stop Order, or Trailing Stop).

5. In the Bracket Up Limit menu, click an order type (New Order, Stop Order, or Trailing Stop).

6. Click OK.

7. The Bracket Order script for the key is set.
Send a Bracket Order
1. In Stock Window, press the key for the Bracket Order (for example, F3).
2. The Bracket Order comment for the lower component appears (for example, Bracket Order Lower Limit (New Order)).
3. Press the pre-assigned key for the order you wish to set as the lower component (for example, F1).
4. The Order Edit Box appears.
5. Type the desired price and shares for the lower component order, and then press Enter.
6. Press the key for the Bracket Order (for example, F3).
7. The Bracket Order comment for the upper component appears (for example, Bracket Order Upper Limit (Stop Order)).
8. Press the pre-assigned key for the Stop Order (for example, F4).
9. The Order Edit Box appears with the Stop Price field.
10. Press the pre-assigned key for the order (Buy or Sell) you wish to set as the upper limit (for example, F2).
11. The Order Edit Box updates to also show the Limit Price and Shares fields.
12. Type the desired stop (trigger) price and the limit price and shares of the order you wish to execute upon the stop price being met.
13. Type the desired price and shares for the upper component order, and then press Enter.
14. The Bracket Order script is set.
15. When the lower or the upper limit is reached, the order gets filled, and the opposite order component gets cancelled automatically.
Bracket Order entry behavior
- If you wish to adjust any of the parameters of the bracket order, then the entire bracket must be cancelled and re-entered.
- If you cancel any one of the bracket's two orders, then the whole bracket will cancel.
- To cancel a bracket order, click the corresponding row in History Log, and then press Esc.
- If you have cancel/replaced any one of the bracket's two orders, then the BracketOrder script will be stopped and the system will only keep the cancel/replaced order.
- If the bracket order script ran successfully, then the order will be cancelled automatically.
Cancel
Use the Cancel window to set up keyboard shortcuts for cancelling certain orders.
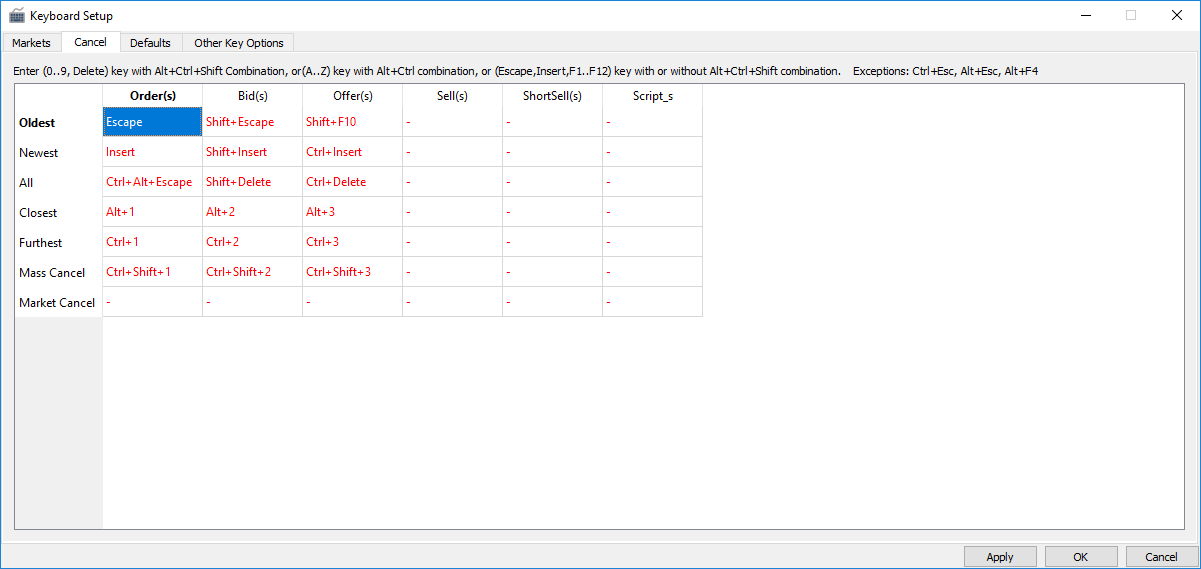
The system has preset default keyboard shortcuts to cancel certain orders.
- Click the cell for a given order configuration, and then press a new key combination to set a new keyboard shortcut.
New: you can now set keyboard shortcuts to cancel all running scripts for all regions/asset classes.
Set up Market Cancel order keyboard shortcut
You can set up a Market Cancel order to request a cancel for all orders on the market of the symbol loaded in the Stock Window. To use this function, follow these steps.
1. In the Keyboard Setup window, click the Cancel tab.
2. In the Market Cancel row, click a cell.
3. Type a keyboard shortcut.
4. Click OK.
5. The Market Cancel keyboard shortcut is set.
Defaults
Use the Defaults window to set up the order name convention as well as the price adjustments for Stop Order Types.
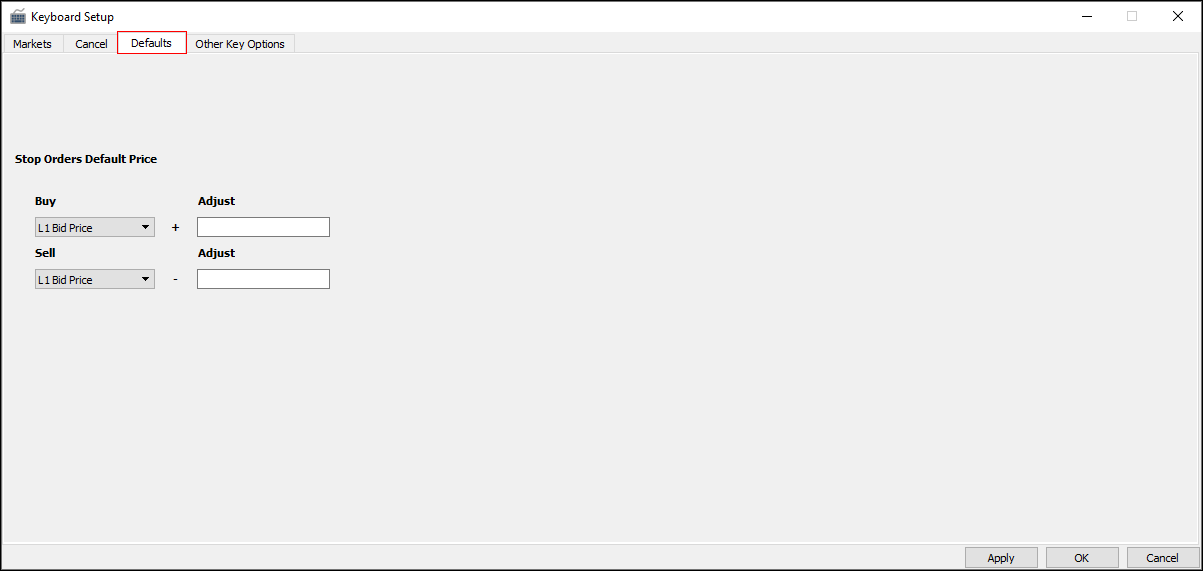
- Stop Orders Default Price: type the Stop Order Type default price adjustment for the Buy side and the Sell side, as needed, and then click OK to save these settings.
Other Key Options
Use the Other Key Options window to set up further key options, such as Key Shave and Use Shares In Multiples.
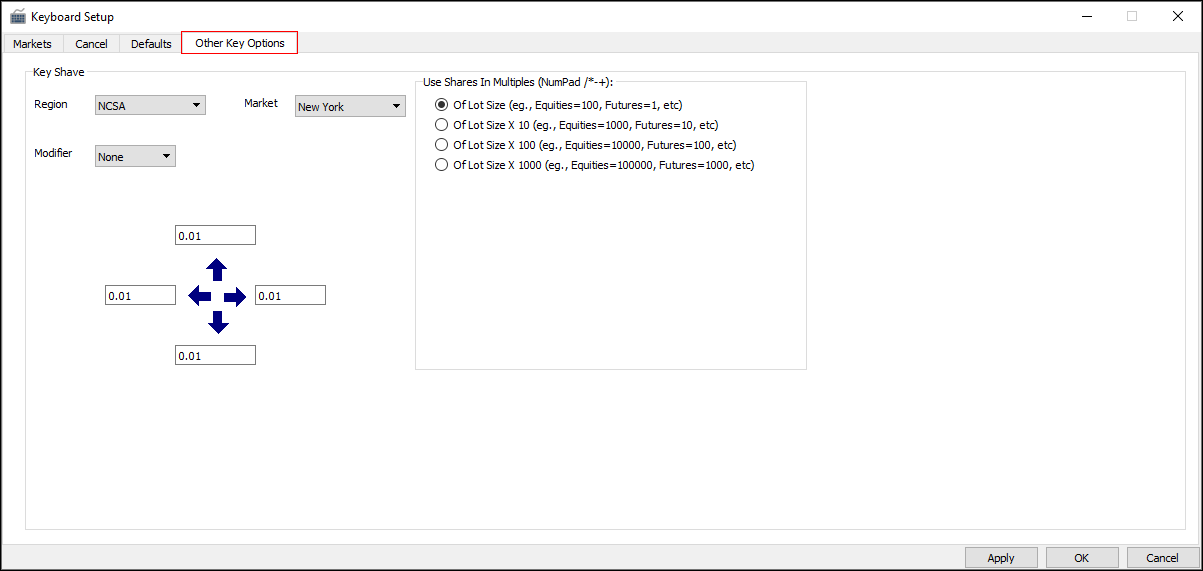
- Region: the region where the market is located
- Market: the market to which the keyboard setup applies
- Modifier: you can choose another modifier key such as Alt, Shift, or Ctrl to use in conjunction with the arrow keys and number keys
- Key Shave Setup: set up the value increment for each arrow key
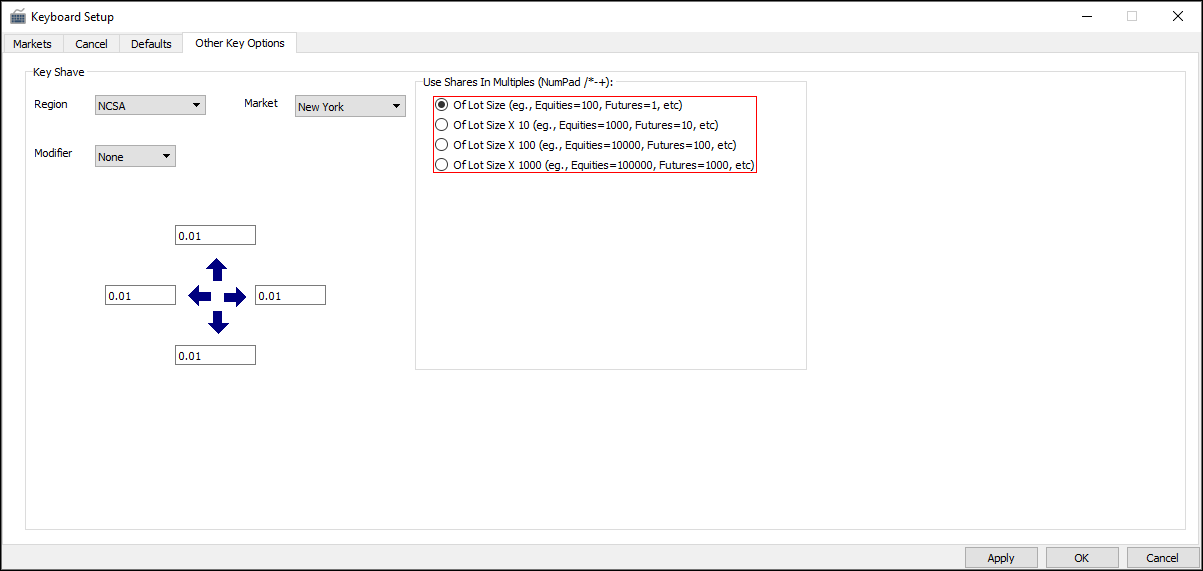
Multiply by Lot Size
You can use the Use Shares In Multiples feature for futures and equities trading. Pressing the arrow keys in the Order Edit Box sets price increments according to the set lot size.
- Equities: volumes per order can be increased by hundreds, thousands, tens of thousands, and hundreds of thousands
- Futures: volumes per order can be increased by contracts (1, 10, 100, and 1000)
>Back to Top
PPro8 Lock/Unlock
Use the PPro8 Lock/Unlock tool to password-lock the PPro8 client, and then unlock to use it again.
Lock PPro8
1. On the PPro8 toolbar, click LockUnlock.

2. PPro8 is locked, and all windows are hidden.

Unlock PPro8
1. On the PPro8 toolbar, click LockUnlock.

2. The Unlock PPro8 window appears.
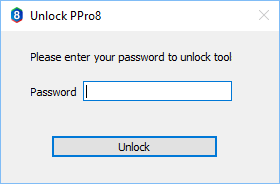
3. Type your PPro8 password in the Password field, and then click Unlock.
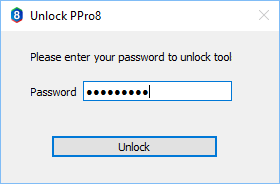
4. PPro8 is unlocked, and all windows appear.
>Back to Top
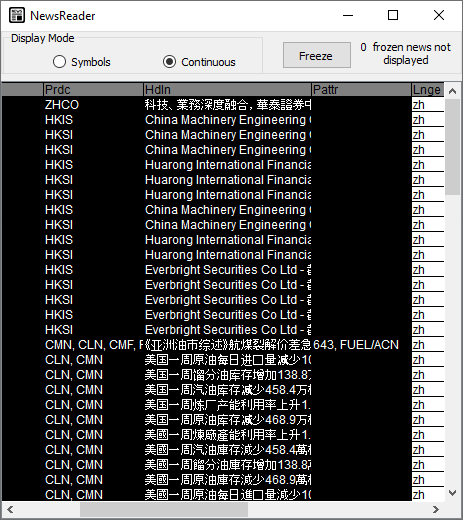
PPro8 News Reader
Use the PPro8 News Reader to see news headlines for trending symbols.
Open the News Reader
1. On the PPro8 toolbar, click NewsReader.

2. The News Reader window appears with two options available, Symbol(s) and Continuous.
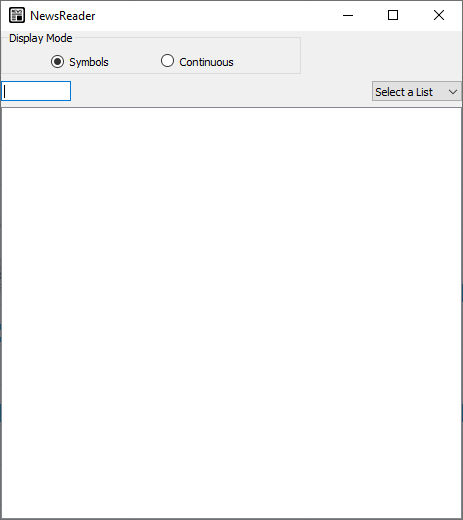
Search for a symbol
1. In the Symbol field, type a symbol.
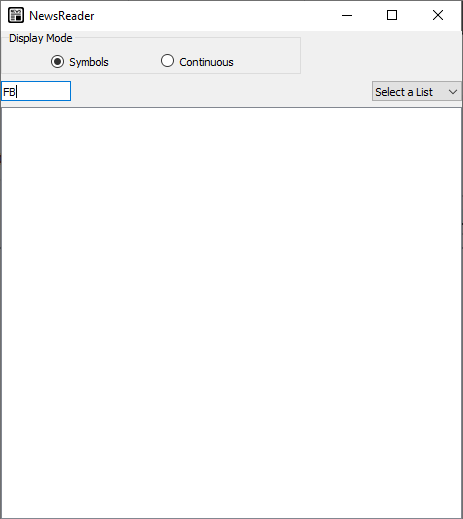
2. Press Tab.
3. Type or click the symbol's market extension.
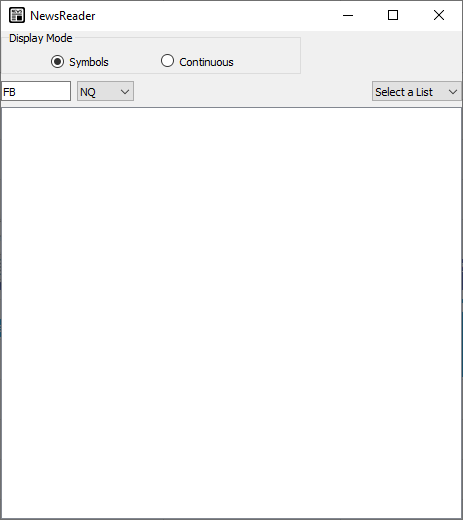
4. Press Enter.
5. A list of news headlines appears.
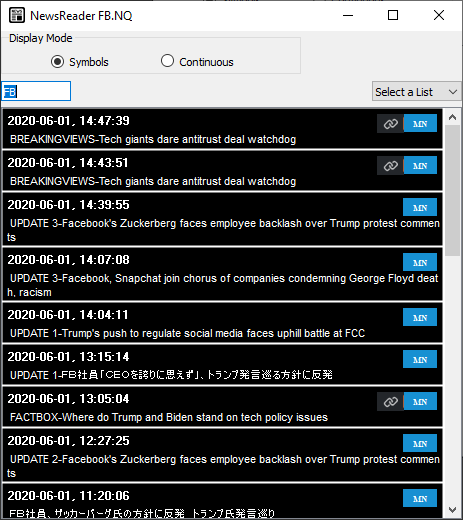
6. Click an embedded link to go to the source webpage of the news headline.
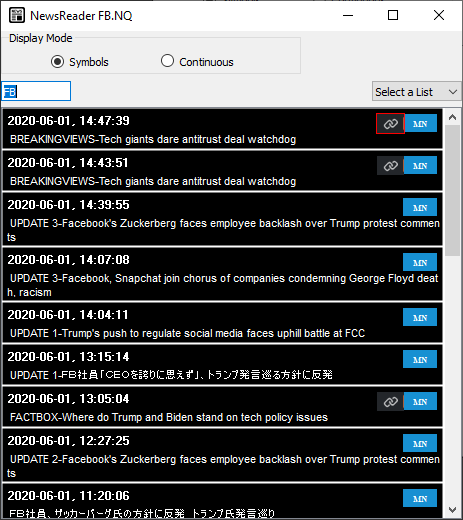
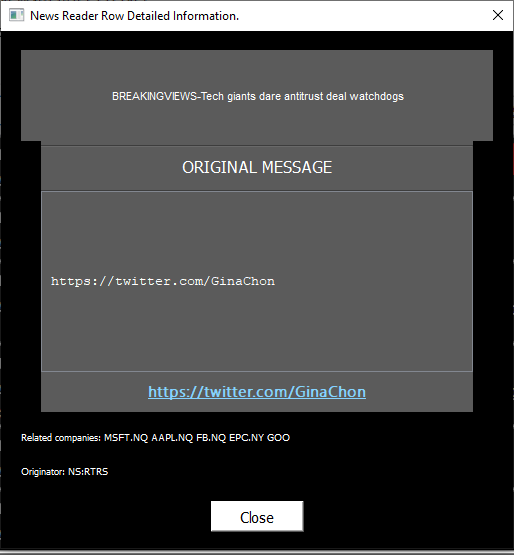
7. Click a headline to see detailed information in a new window, including:
- original message
- link to the source
- related companies
- originator information
New: you can now copy and paste news message text from the News Reader to, for example, a translator app.
8. Read symbol news, be informed about market moves, and trade accordingly.
Load headlines for a symbol list
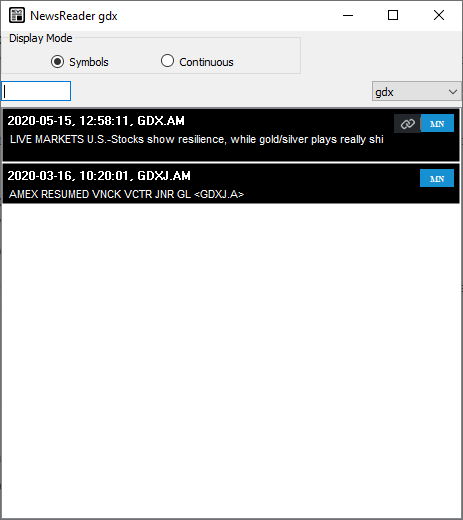
1. In the Select a List menu, select a symbol list (lists can be created in Symbols List Editor).
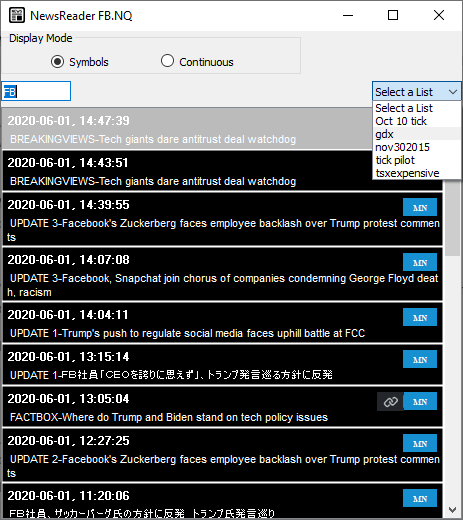
2. The headlines for the symbol list appear.
Load headlines in Continuous view
1. At the top of the News Reader window, select the Continuous option.
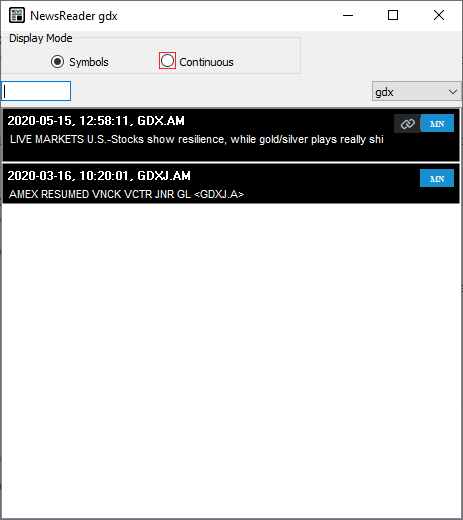
2. The Continuous view appears, showing live streaming headlines as they come in through the feed.
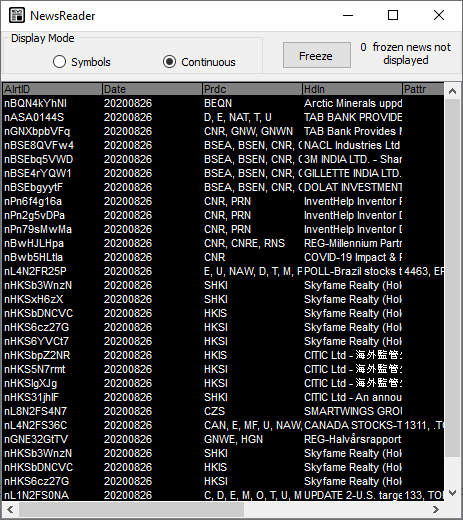
3. You can double-click a row to see more information about each headline.
Continuous view
Introduction
Powered by Refinitiv, offered exclusively by Day Trade The World™, the News Reader now supports the powerful Regex Syntax in Column filter, which gives you unlimited potential to personalize your news feeds. Plus, we now offer 40 example filter rules that you can try today!
Because only about 40% of news stories on the web have a symbol associated with them, that means 60% percent or more of news stories never made it to Symbol view. Hence, it used to be that there were limited news available in News Reader.
Now, with the new Continuous View, traders can see 100% percent of the stories that matter to them. Every bit of news that the Refinitiv system generates gets passed right on through to the PPro8 client. We do not process or delete anything from the feed. It’s like having the entire Refinitiv news database at your fingertips. On the PPro8 client side, you can decide what you want to filter to assist you in your trading, and make your trading decisions right away.
In sum, the News Reader is a useful tool for managers, traders, office owners, and everyone who’s part of the DTTW™ family. It loads news stories quickly; offers up-to-the-minute news in 32 languages; allows for copy-and-pasting into translator apps; and makes it easy to search and filter through the sea of news stories to find the most relevant information for your trading needs.
For more information, you can see the PPro8 News Reader Code Reference Guide: PDF or Excel.
Note: please ensure that you research your news sources well. Depending on the origin country, headlines will appear at different times of the day or week due to time zone and language differences.
Note: some headlines will appear faster or slower than others throughout the day, depending on the news agency or source, and whether or not there are many (or few) news-worthy stories that day.
Note: at this time, the copy-and-pasting function applies only to the news message contents, not the headline.
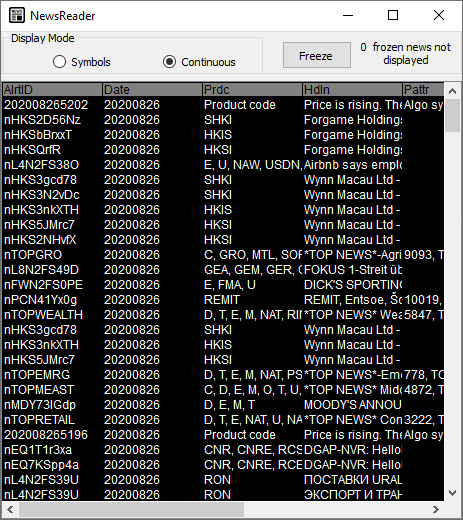
Available columns
- AlrtID (Alert ID): a unique code to identify a given news alert
- Note: the Alert ID stays the same if there are any updates or follow up headlines on a given news story
- Examples:
- nRTV4jnN6G
- nBw8vX0yma
- nL8N25B4TQ
- Date: the date of the news release
- Examples:
- 20190813 (for August 13, 2019)
- 20190920 (for September 20, 2019)
- 20200103 (for January 3, 2020)
- Prdc (Product Code): product codes identify which desktop news product(s) the news item belongs to; they are typically tailored to very specific audiences
- Examples:
- RBR, C, D, E, M, O, T, U
- MTL, GRO, SOF, OIL, MNI, NAT
- AEN, SP, DNP
- Hdln (Headline): the subject/headline text of the news item
- Examples:
- “Reuters Insider - CBS, Viacom warn merger to cause job losses, hint potential deals ahead: Alex Sherman”
- “Blue Cross Blue Shield of Massachusetts Announces Second Quarter 2019 Financial Results”
- 国际油市:汽油裂解价差差承压,因供应充足
- Pattr (Pattern Code): pattern codes, also known as recurring report codes, identify news items that follow a pattern. Items sharing the same code cover periodic updates to the same subject matter and often have very similar headlines
- Note: not all news items have this code
- Examples:
- 133, 1259, 10070
- 4780, US/RETAIL1
- 1785, LDIS/ACN
- Lnge (Language): language code
- Examples:
- en (for English)
- ru (for Russian)
- zh (for Chinese)
- Src (Source): identifier for the source that provided the news item
- Examples:
- RCNBC (for Reuters Insider CNBC Content)
- BSW (Business Wire)
- RTRS (Reuters)
- RltSym (Related Symbols): company identifiers that relate to this news item.
- Note: if the prefix is S, the symbol is in the PPro8 system
- Note: if the prefix is R, it is a Reuters symbol that is not in the PPro8 system
- Examples:
- S:{RKR.VN} ← this symbol is in the system and available to trade
- R:{PRN.TO} ← this symbol is not in our system, and a manager has to submit a mojo to request to add it
- Sbjcts (Subjects): subject codes and company identifiers that relate to this news item
- Examples:
- A:{4} (for news about the commodities markets)
- E:{1,40,44} (for news about corporate events, products/services, and commercial contract wins/terminations)
- Tm (Time): the timestamp for when the alert was received (in Coordinated Universal Time, i.e., UTC)
- Example: 20:21:51
For more information on what each code means, you can see the PPro8 News Reader Code Reference Guide: PDF or Excel.
Filter and search for news messages
Here are the steps for making the most of the News Reader tool’s Continuous view mode.
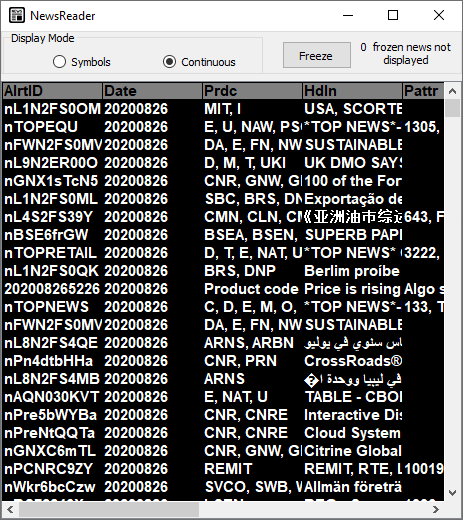
1. Open the News Reader tool, and then select the Continuous view option
2. A continuous stream of news headlines and associated data will populate the News Reader window
3. Right-click anywhere in the News Reader to open the News Reader Customization Window
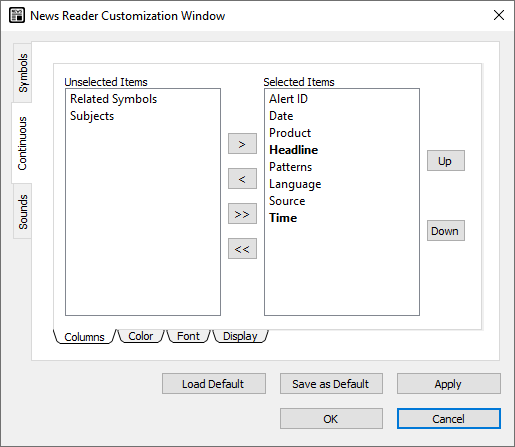
4. In the Continuous pane, select the Related Symbols and the Subjects items in the Unselected Items list, and then click the > arrow to move them to the Selected Items list, one by one
5. Click the Font sub-tab to open the Font pane
6. In the Font pane, click the Set Font button
7. In the Select Font window, under Size, you can select a larger font size for easier readability, and adjust other font settings according to your preferences (for example, Arial, Bold, 11)
8. Click OK
9. The new columns and the new font size appear in the News Reader tool
Tips:
- You can resize the News Reader window by clicking and dragging its corners; or
- Drag the horizontal scroll bar to see more; or
- Double-click the vertical line between any two column headings to resize each column to its full width
10. Right-click on a column heading to open the Alfa Regular Expression Filter window, for example, Lnge (Language)
- Note: you can filter the following columns only: Prdc, Pattr, Lnge, Src, RltSym, Sbjcts
11. In the Alfa Regular Expression Filter window, click ActivateFilter For “Language”
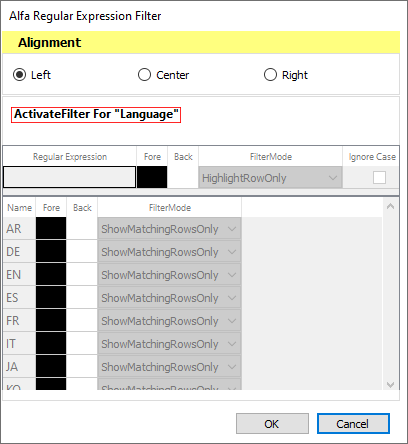
12. The filter options appear. Type a Language code in the Regular Expression field (for example, zh for Chinese), ensure the show menu option is selected, and then click OK
- Note: the Regular Expressions field is case-sensitive
- Note: a Regular Expression is a sequence of characters that defines a search pattern. To learn more, you can see this site: https://cs.lmu.edu/~ray/notes/regex/
- To hide a column filter by name, select the check box for the name under the Hide column (for example, de for German), and then click OK
13. The Continuous View populates with headlines
14. Double-click a headline row to open the Detailed Information window for the news item
15. Read news messages and trade accordingly
16. To turn off a column filter, open the Alfa Regular Expression Filter window for the column, and then click DisableFilter For “Language”
17. The filter is disabled and news stories stream in, unfiltered
Note: you can have multiple column filters activated at once, or you can set one filter to be active at a time. Remember to disable any extra filters if they’re not needed, as they may interfere with each other, or lead to limited news results appearing.
Note: to quickly see if a column filter is activated or not, you can move your mouse cursor over a column heading (for example, Prdc), and if a filter is active, a small tooltip message will appear: 
Note: you can open up to four (4) instances of the News Reader window at the same time. This is useful when you want to track multiple markets.
Examples of regular expressions and formulas
| Example | Filter Column | Description | Return |
|---|---|---|---|
| PGA|PGF | Prdc | Formula for an or expression | Finds news from product PGA (Platts News Service - Global Alert) or PGF (Platts News Service - Feedstock Add-On). E.g., “PLATTS: 1397–Platts European MTBE/ETBE Market Commentary - 19Aug19” |
| (?=.*B:)(?=.*1649) | Sbjcts | Formula for an and expression | Finds news that have Prefix B and Value 1649. E.g., “ISE - Rule 38.5 - Replacement of ABBVIE INC” |
| \bP\b, \bSP\b | Sbjcts | Formula for a bounded expression when a value has 1 or 2 characters | Finds news for the P and/or SP subjects. E.g., “UPDATE 2-Schools deserted in Indian Kashmir as parents fear more unrest” |
| P* | Sbjcts | Formula for a wildcard expression that contains an unknown text value (*) | Finds news that contains P, followed by other characters. E.g., {P,PGA,PGF}. E.g., “AKU Akumin acquires five Texas imaging centres” |
For more examples of formulas you can use, see the PPro8 News Reader Code Reference Guide: PDF or Excel.
News Reader Customization
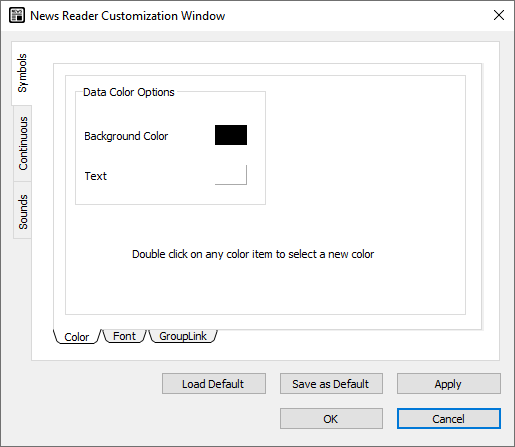
To make changes to the News Reader settings, right-click anywhere in the News Reader to open the News Reader Customization window.
This window displays two tabs on the left: Symbols and Continuous.
Symbols
Use the Symbols window to adjust the display settings for the News Reader.
- Click the Symbols tab to open the Symbols window.
The Symbols window contains three sub-tabs: Color, Font, and GroupLink.
Color
Use the Color window to adjust color settings for the News Reader.
1. Click the Color sub-tab in the Symbols window.
2. The Color window appears.
3. In the Data Color Options section, double-click the color box for either of two options: Background Color or Text.
4. The Color Selector window appears. Click a color, and then click OK.
5. In the Customization window, click OK.
6. The data color is set.
Font
Use the Font window to set the overall font for the News Reader window.
1. Click the Font sub-tab.
2. The Font window appears.
3. Click the Set Font button.
4. The Select Font window appears.
5. Click the font, font style, size, effects, and writing system you want to set.
6. Click OK.
7. In the Customization window, click OK.
8. The font is set.
GroupLink
1. Select the Link Window to Group Number check box.
2. Type the number of the window you would like to link the News Reader window to.
3. Click OK.
4. The link is set. A symbol change in a linked window (for example, the Stock Window), will load the latest news headlines for the symbol in the News Reader.
Continuous
Use the Continuous window to adjust the settings for the Continuous view.
- Click the Continuous tab to open the Continuous window.
The Continuous window contains four sub-tabs: Columns, Color, Font, and Display.
Columns
Use the Columns window to show, hide, or sort the following columns:
- Alert ID
- Date
- Product
- Headline
- Patterns
- Language
- Source
- Time
- Related Symbols
- Subjects
1. To show a column, click an item in the Unselected items list.
2. Click the right arrow to move the item to the Selected items list.
3. Click OK.
4. The column appears in the News Reader window.
5. To hide a column, click an item in the Selected items list.
6. Click the left arrow to move the item to the Unselected items list.
7. Click OK.
8. The column is hidden from the News Reader window.
Color
Use the Color window to adjust color settings.
1. Click the Color sub-tab.
2. The Color window appears.
3. In the Data Color Options or the Header Color Options sections, double-click a color box.
4. The Color Selector window appears. Click a color, and then click OK.
5. In the Customization window, click OK.
6. The color option is set.
Font
Use the Font window to set the overall font.
1. Click the Font sub-tab.
2. The Font window appears.
3. Click the Set Font button.
4. The Select Font window appears.
5. Click the font, font style, size, effects, and writing system you want to set.
6. Click OK.
7. In the Customization window, click OK.
8. The font is set.
Display
Use the Display window to set grid lines.
1. Click the Display sub-tab.
2. Select the Show Grid Lines check box.
3. Click OK.
4. The grid lines are set.
>Back to Top
PPro8 Order List
Use the PPro8 Order List window to create a list of orders to use with the Keyboard Setup Order List option.
Open the Order List window
1. On the PPro8 toolbar, click OrderList.

2. The Order List window appears.

Order List window components

A. Region: click the region where the market is located.
B. Market: click the market for the orders.
C. List name: click a list name to load a saved order list. To create a new order list, click New, type a name in the List Name window, and then click OK.
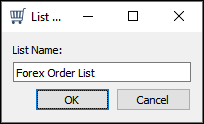
- After naming the order list, double-click a blank cell in the row that appears to open the Single Order Window.

Single Order Window
Use the Single Order Window to add an order to the list by clicking or typing specific order information.

- Size Multiplier: the unit share size for the order.
- Gateway: the gateway the order will be sent through.
- Side: Buy/Sell/Short Sell.
- Destination: the market or exchange name.
- Order Type: after clicking the destination, click the order type.
- Reference Side: click to choose whether the order’s price will reference the near side or the far side of the Level 1 quote.
- Price Adjust: type the price adjustment amount if the order is a Limit order and the reference side is Near or Far. If the reference side is None, type the Limit Price.
- TIF (Time in Force): click a TIF setting for the order.
- Min Size: the minimum execution size for the order, if any.

1. Click OK in the Single Order Window to save the new single order. Add more orders as needed.
2. Click Save to save the new order list.
3. When saved, the order list appears in Keyboard Setup in the Order Setup Dialog window under the Order List option.
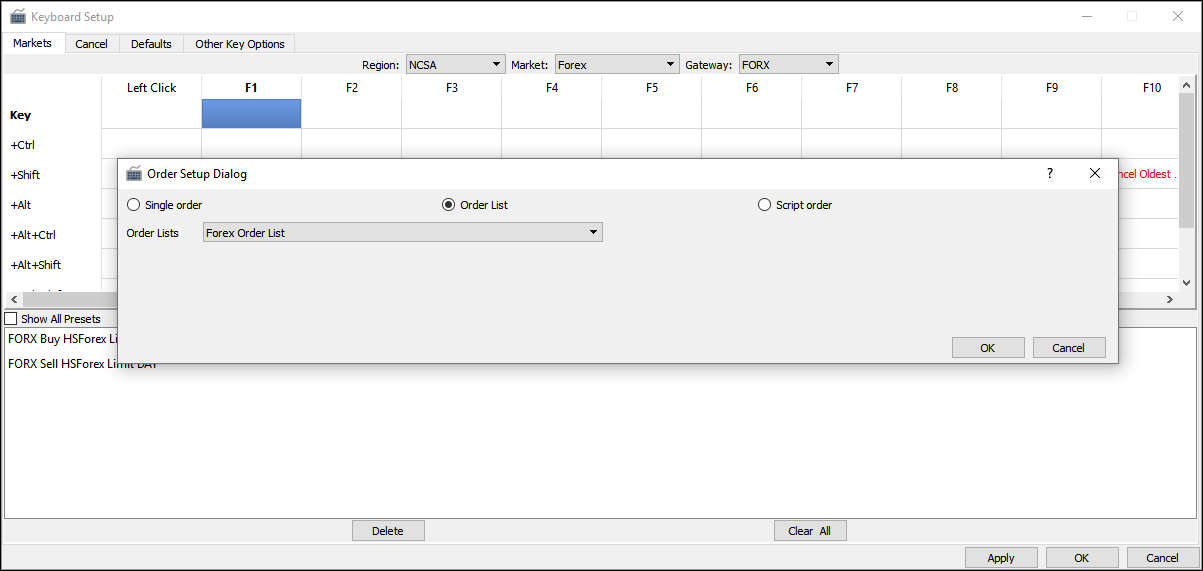
4. Use Keyboard Setup to set up a keyboard shortcut for the order list.
>Back to Top
PPro8 Order Status
Use the PPro8 Order Status window look up the status of your orders.
Open an Order Status window
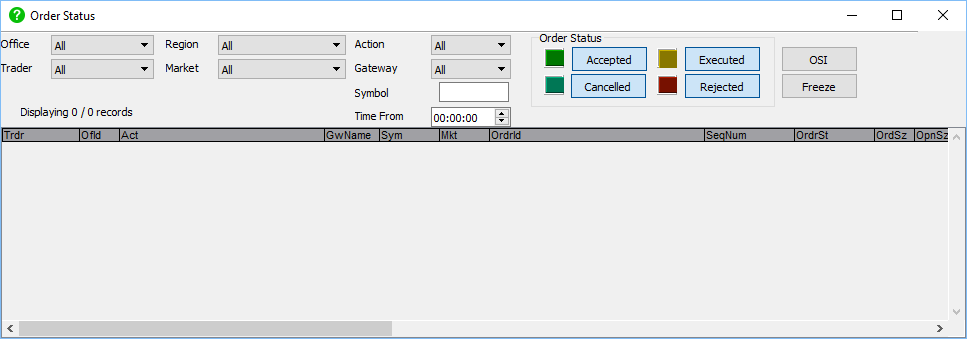
1. On the PPro8 toolbar, click OrderStatus.

2. The Order Status window appears.
Filter orders
Use the filter function to filter the order you want to find by the following parameters:
- Office: the office ID
- Region: the region where the market is located
- Trader: the trader ID
- Market: the market where the order was sent
- Action: the side of the order
- Gateway: the gateway where the order was sent
- Symbol: the symbol of the order
- Time(From): the time period from which the order was sent
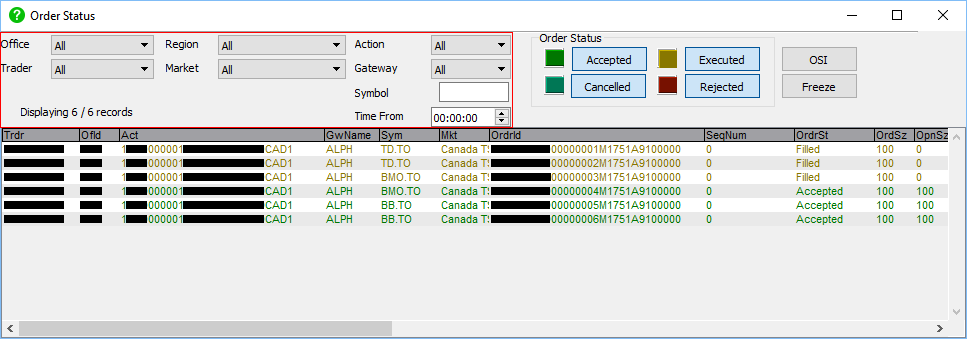
1. Click the (All) menu for each parameter you want to filter by, and then click an item.
2. Type a symbol, and then type or click a time you want to filter by.
3. The Order Status window shows the status of orders based on the filters you set.
Change order status color
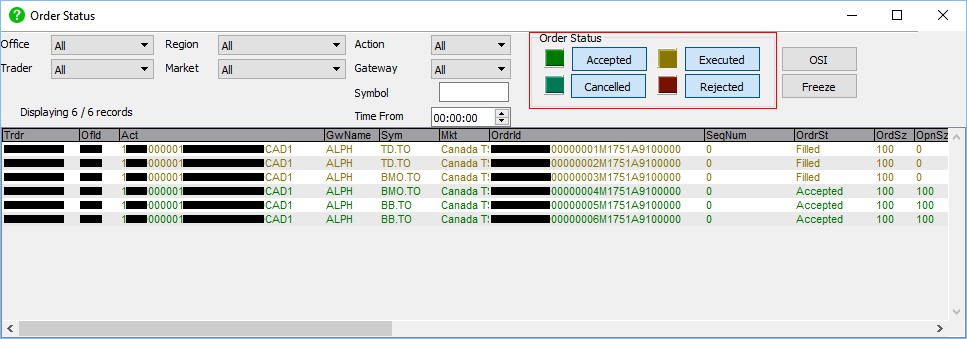
Use the color customization function to change the color of orders by status, whether accepted, filled, cancelled, executed, or rejected.
1. Double-click a color box for the order status type you want to change the color for.
2. The Color Selector window appears.
3. Click a color, and then click OK.
4. The new color is set.
Order Status components
The Order Status window shows the following information on all sent orders:
- Trdr (Trader Id): the trader ID for the order
- OfId (Office Code): the office code for the order
- Act (Account): the account ID for the order
- GwName (Gateway Name): the name of the gateway where the order was sent
- Sym (Symbol): the symbol of the order
- Mkt (Market Name): the market for the order
- OrdrId (Order Id): the automatically generated order ID that uniquely identifies the order
- SeqNum (Sequence Number): the sequence number for the order
- OrdrSt (Order State Name): the order status of the order
- OrdSz (Order Size): the order size
- OpnSz (Open Size): the open size of the order
- FilSz (Filled Size): the fill size of the order
- ExecSz (Execution Size): the execution size of the order
- OrdPx (Order Price): the accepted price of the order
- ExecPx (Execution Price): the execution price of the order
- Cy (Currency Name): the currency of the order
- MktTime (Market Time): the local market time of the order
- Reg (Region Name): the market region of the order
- DstName (Destination Name): the destination name of the order
- ViaApi (Order sent via PProApi): whether the order was sent via PProAPI—Yes or No
- OrdCls (Order Class): the name of the order from Keyboard Setup
- AutoCn (AutoCancel): whether AutoCancel was on—Yes or No
- ClntTime (Client Local Time): the time of the order on the local client side
- Info (Information): other information about the order, such as liquidity flags and tags
- LstEvnt (Last Order Event): the last event of the order
- MktCnclRjct# (Number of Market Rejects): the number of rejections by the market
- OpnCnclRjct# (Number of OPC Rejects): the number of rejections by the OPC server
- Side: the side of the order
To select multiple orders, use Shift + Mouse Click.
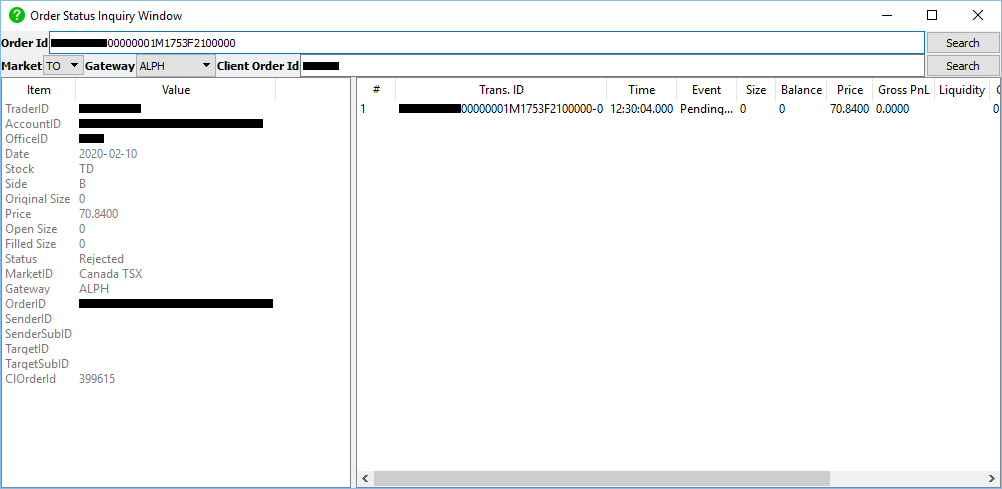
Order Status Inquiry Window
Use the Order Status Inquiry Window to view detailed information about each order, and search through orders by order number, gateway, and client order ID.
- Double-click an order to open the Order Status Inquiry Window. Or, click OSI.
Search order statuses
1. In the Order Status Inquiry Window, click the Market or Gateway menu to show order status by market or gateway.
2. Type or paste the Order Id or Client Order Id in the respective field, and then press Enter, to show order status by order ID or client order ID.
- Order Id: the automatically generated order ID that uniquely identifies the order in PPro8
- Gateway: the gateway where the order was sent
- Client Order Id: the automatically generated order ID that uniquely identifies the order in the market
Freeze and unfreeze the Order Status window
1. To freeze a snapshot of the Order Status window at any time, click Freeze in the Order Status window.
2. To unfreeze the Order Status window, click Unfreeze.
Order Status Customization
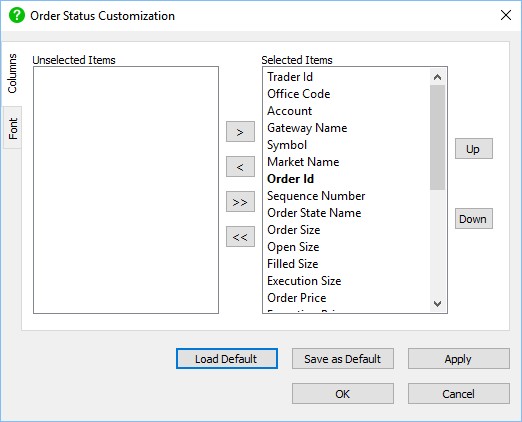
To make changes to the Order Status settings, right-click anywhere in the Order Status window, and then click Order Status Customization to open the Order Status Customization Dialog window. Or, click Ctrl + O. This window displays two tabs on the left: Columns and Font.
Columns
Use the Columns window to show or hide items in the Order Status window.
- Click the Columns tab to open the Columns window.
Hide an item from the Order Status window
1. In the Columns window, click an item in the Selected Items list.
2. Click the left arrow to move the item to the Unselected items list.
3. Click OK.
4. The item is hidden from the Order Status window.
Show an item in the Order Status window
1. In the Columns window, click an item in the Unselected items list.
2. Click the right arrow to move the item to the Selected items list.
3. Click OK.
4. The item is hidden from the Order Status window.
Font
Use the Font window to set the overall font for the Order Status window.
- Click the Font tab to open the Font window.
Set a font for the Order Status window
1. In the Font window, click Set Font.
2. The Select Font window appears.
3. Click the font, font styles, size, effects, and writing system you want to set.
4. Click OK.
5. In the Order Status Customization window, click OK.
6. The new font is set.
>Back to Top
PPro8 Quote Board
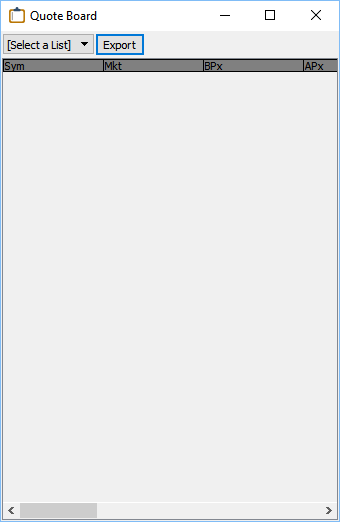
Use the PPro8 Quote Board to view Level 1 quotes for multiple symbols in a summary table.
Open the Quote Board
1. On the PPro8 toolbar, click QuoteBoard.

2. The Quote Board appears.
Load Level 1 quotes for multiple symbols
1. Open the Quote Board.
2. Click the [Select a list] menu, and then click a symbol list.
3. The Level 1 quotes appear for the symbol list in the local currency.
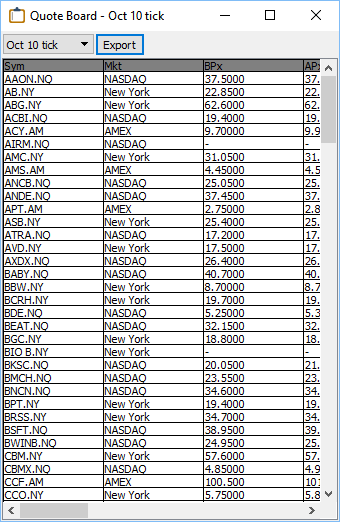
Note: to load Level 1 quotes in the Quote Board, you must first create a list in the Symbols List Editor.
Export Quote Board data
- To export Quote Board information into a CSV file, load a symbols list, and then click Export.
Quote Board Customization
To make changes to the Quote Board settings, right-click anywhere in the Quote Board to open the Quote Board Customization window. This window displays three main tabs on the left: Display, Color, and Alerts.
Display
Use the Display window to adjust the display settings for the Quote Board.
- Click the Display tab to open the Display window.
The Display window contains four sub-tabs: LinesBars, Columns, Font, and GroupLink.
LinesBars
Use the LinesBars window to show or hide scroll bars, grid line, or the header.
1. Click the LinesBars sub-tab in the Display window.
2. The LinesBars window appears.
Hide an item from the Quote Board
1. In the LinesBars window, click an item in the Selected Items list.
2. Click the left arrow to move the item to the Unselected Items list.
3. Click OK.
4. The item is hidden from the Quote Board.
Show an item in the Quote Board
1. In the LinesBars window, click an item in the Unselected Items list.
2. Click the right arrow to move the item to the Selected Items list.
3. Click OK.
4. The item appears in the Quote Board.
Columns
Use the Columns window to manage columns that appear in the Quote Board.
1. Click the Columns sub-tab in the Display window.
2. The Columns window appears.
As in the above instructions for LinesBars, all items moved to the Selected items side appear in the Quote Board, and all items moved to the Unselected items side are hidden, when the settings are saved.
Font
Use the Font window to set the overall font for the Quote Board.
1. In the Display window, click the Font sub-tab.
2. The Font window appears.
3. Click Set Font.
4. The Select Font window appears.
5. Click the font, font style, size, effects, and writing system you want to set.
6. Click OK.
7. In the Customization window, click OK.
8. The font is set in the Quote Board.
GroupLink
Use the GroupLink window to group the Quote Board with other windows, such as the Stock Window and Time of Sales, by number.
1. In the Display window, click the GroupLink sub-tab.
2. The GroupLink window appears.
3. Select the LinkWindowToGroupNumber check box.
4. Type the number of the window group you want to add the Quote Board to.
5. Click OK.
6. The Quote Board is linked to a window group.
Color
Use the Color options window to set the colors for Quote Board elements.
1. In the Customization window, click the Color tab.
2. The Color Options window appears.
Set a color
1. In the Color Options window, double-click a color box, for example, Background color for Row Colors.
2. The Color Selector window appears.
3. Click a color, and then click OK.
4. In the Customization window, click OK.
5. The color is set.
Alerts
Use the Alerts window to set alerts for symbols based on specific criteria.
1. In the Customization window, click Alerts.
2. The Alert Options window appears.
Set an alert
1. With a symbol list loaded in the Quote Board, select the Display alerts check box in the Alert Options window.
2. Click the New Alert button.
3. Click a Symbol, click an Alert Type, click a Condition, and type a Parameter value for the symbol.
4. To set a sound effect for the alert, click the (…) button, click a WAV sound file in the media folder, and then click Open.
5. Select the check box for the symbol, and then click OK.
6. The alert and alert sound effect are set.
7. To reset an alert, click the Reset button. To reset all alerts, click Reset All.
Alignment Editor and Filter Option
Use the Alignment Editor and Filter Option to align columns to the left, center, or right, and to set a filter for the Quote Board window.
Align a column and activate a filter in the Quote Board window
1. Right-click a column heading, such as Sym, in the Quote Board window.
2. The Alignment Editor and Filter Option appear.
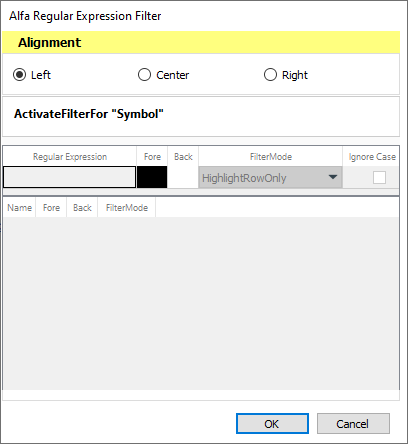
3. In the Alignment section, click Left, Center, or Right to align the column left, center, or right.
4. Click Activate filter for Symbol to set the filter option.
5. Click a filter parameter option, type a value or values, and double-click the color boxes to set colors for the filter.
6. Click OK.
7. The column is aligned and the filter is activated for the column.
>Back to Top
PPro8 Save Layout
Use the PPro8 Save Layout tool to save the layout of open windows on the screen.
1. On the PPro8 toolbar, click SaveLayout.

2. The layout is saved.
>Back to Top
PPro8 Script Monitor
Use the PPro8 Script Monitor to monitor and confirm script orders, such as Stop, Trailing Stop, Basket, and Order List.
Open Script Monitor
1. On the PPro8 toolbar, click ScriptMonitor.

2. The Script Monitor window appears.
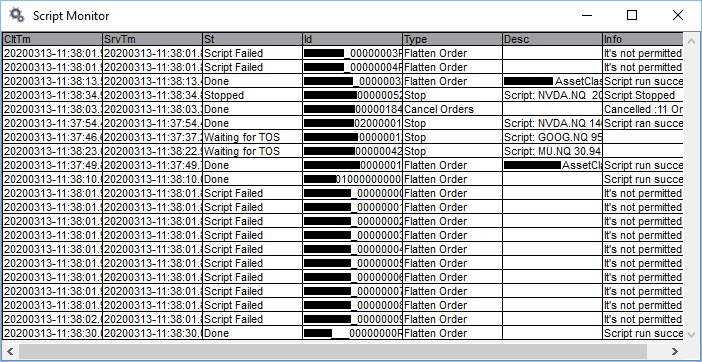
Script Monitor components
The Script Monitor shows the following information for each script order:
- CltTm: Client Time
- SrvTm: Server Time
- St: Script State
- Id: Script ID
- Type
- Desc: Description
- Info: Information
- OffId: Office ID
Stop a script
1. Right-click the script order you want to stop.
2. In the menu that appears, click Stop Script.
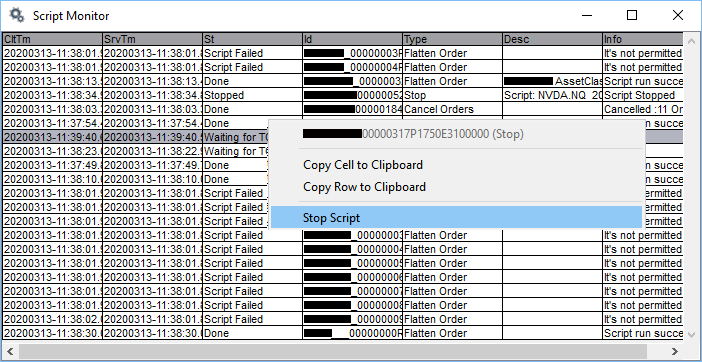
3. The script is stopped.
- To cancel an active script, click the script order row, and then press Esc.
Save script information to clipboard
- Right-click a cell or row, and then click Copy Cell to Clipboard or Copy Row to Clipboard to save to clipboard.
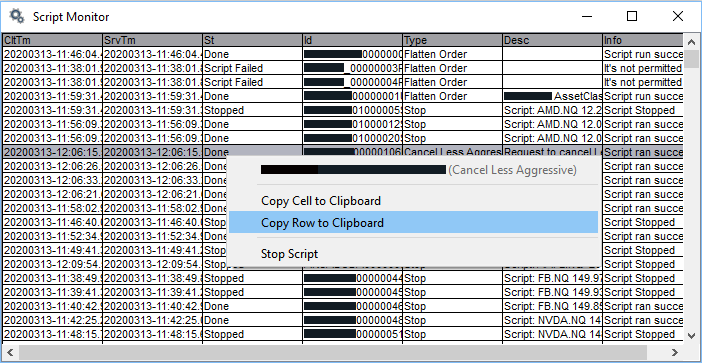
>Back to Top
PPro8 Stock Window
The PPro8 Stock Window displays market depth data, in Level 1 (Lv1) and Level 2 (Lv2), for trading instruments.
Use the Stock Window to view an instrument's supply and demand, and to enter orders. You can enter orders through the Stock Window by using keyboard shortcuts. Keyboard shortcuts are fully customizable in Keyboard Setup.
The PPro8 framework now supports Deregister for a symbol using slash '/' or backslash '\'.
Open a new Stock Window
1. On the PPro8 toolbar, click StockWindow.

2. An empty Stock Window appears.
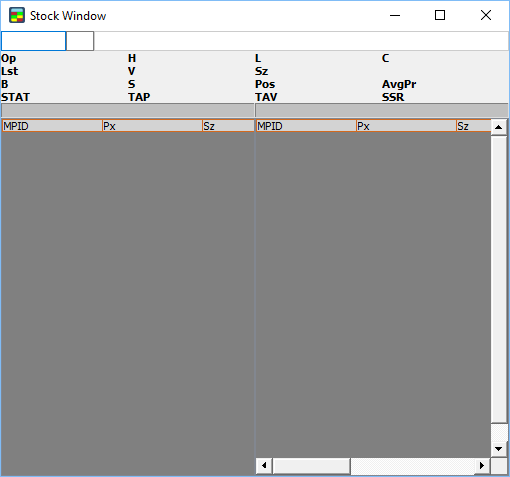
View market depth data in the Stock Window
1. Type the symbol in the first field of the Order Edit Box at the top left (for example, BB).
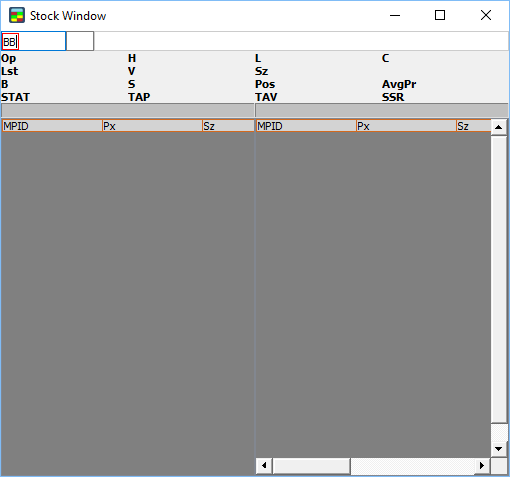
2. Press Tab.
3. Type or click the symbol's market extension (for example, TO).
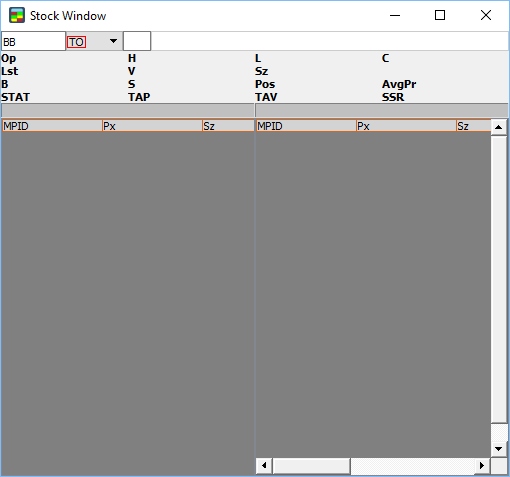
4. Press Enter.
5. The Stock Window populates with information about the symbol, in the header, Lv1, and Lv2.
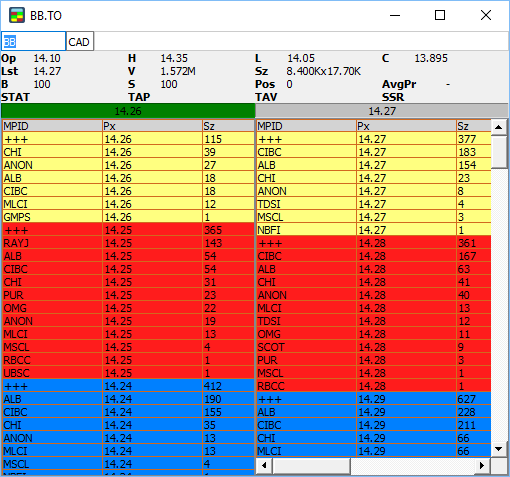
- To use the copy-and-paste function in the Stock Window, right click the symbol in the symbol field, click Copy or press Ctrl + C, click Paste or press Ctrl + V in another Stock Window, type or click the market extension, and then press Enter to load market data for the symbol.
Stock Window components
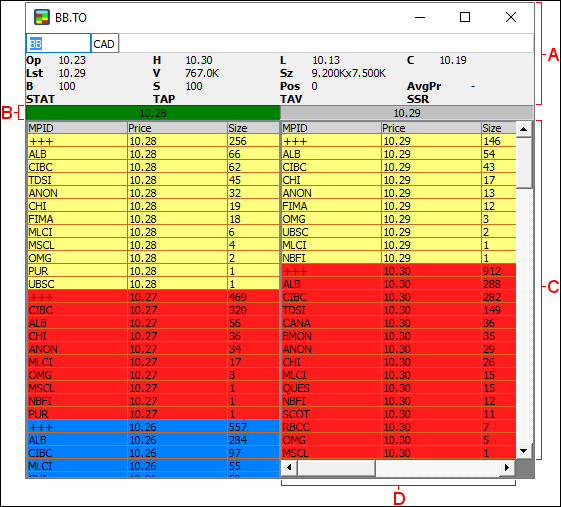
A. The header and instrument row contain the following items:
- Order entry box: for the symbol being tracked.
- Op (Opening price): the opening price of the security.
- Lst (Last price): the most recent print. The price is denominated in the local market currency.
- Sz (Size): the number of shares for each Market Maker ID (MMID).
- V (Volume): the total number of shares executed so far.
- H (Highest price): the highest print of the day.
- L (Lowest price): the lowest print of the day.
- B (Buy): the number of shares set for the buy side.
- S (Sell): the number of shares set for the sell side.
- Pos (Position): the size of the position.
- AvgPr (Average Price): the average price of the stock.
- Theoretical auction values for equities:
- TAT (Theoretical Auction Type): the name of an auction type that depends on the market, whether Opening, Closing, Intraday, or Halted.
- TAP (Theoretical Auction Price): the value at which an auction is expected to open.
- TAV (Theoretical Auction Volume): the auction trading volume.
B. Best Bid (left) and Best Offer (right).
C. Lv1 and Lv2: Lv1 is the first row in the market depth table, while Lv2 is composed of the rows that follow. Lv1 and Lv2 contain the following items by default:
- MPID (Market Participant Identifier): the shortened name of the quoted market/ECN or book.
- Price: the price of the security.
- Sz (Size): the number of shares for each MMID.
- Time: the time at which the oldest Bid/Offer on that level was entered.
- Depth: the number of participating orders on that level.
- Total: the cumulative number of shares per price level, available only on the consolidated (+++) book.
D. The horizontal scroll bar at the bottom of the Ask side (right) affects the Bid side (left) as well. Move the scroll bar left or right to move both sides horizontally at the same time. Similarly, move the vertical scroll bar on the right of the Ask side to move both sides vertically at the same time.
Send a Bracket Order
1. Configure a Bracket Order in Keyboard Setup.
2. In the Stock Window, press the key for the Bracket Order (for example, F3).
3. The Bracket Order comment for the lower component appears (for example, Bracket Order Lower Limit (New Order)).
4. Press the pre-assigned key for the order you wish to set as the lower component (for example, F1).
5. The Order Edit Box appears.
6. Type the desired price and shares for the lower component order, and then press Enter.
7. Press the key for the Bracket Order (for example, F3).
8. The Bracket Order comment for the upper component appears (for example, Bracket Order Upper Limit (Stop Order)).
9. Press the pre-assigned key for the Stop Order (for example, F4).
10. The Order Edit Box appears with the Stop Price field.
11. Press the pre-assigned key for the order (Buy or Sell) you wish to set as the upper limit (for example, F2).
12. The Order Edit Box updates to also show the Limit Price and Shares fields.
13. Type the desired stop (trigger) price and the limit price and shares of the order you wish to execute upon the stop price being met.
14. Type the desired price and shares for the upper component order, and then press Enter.
15. The Bracket Order script is set.
16. When the lower or the upper limit is reached, the order gets filled, and the opposite order component gets cancelled automatically.
Bracket Order entry behavior
- If you wish to adjust any of the parameters of the bracket order, then the entire bracket must be cancelled and re-entered.
- If you cancel any one of the bracket's two orders, then the whole bracket will cancel.
- To cancel a bracket order, click the corresponding row in History Log, and then press Esc.
- If you have cancel/replaced any one of the bracket's two orders, then the BracketOrder script will be stopped and the system will only keep the cancel/replaced order.
- If the bracket order script ran successfully, then the order will be cancelled automatically.
Stock Window Customization
To make changes to the Stock Window settings, right-click anywhere in the Stock Window to open the Stock Window Customization window. This window displays three main tabs on the left: Display, Color, and Settings.
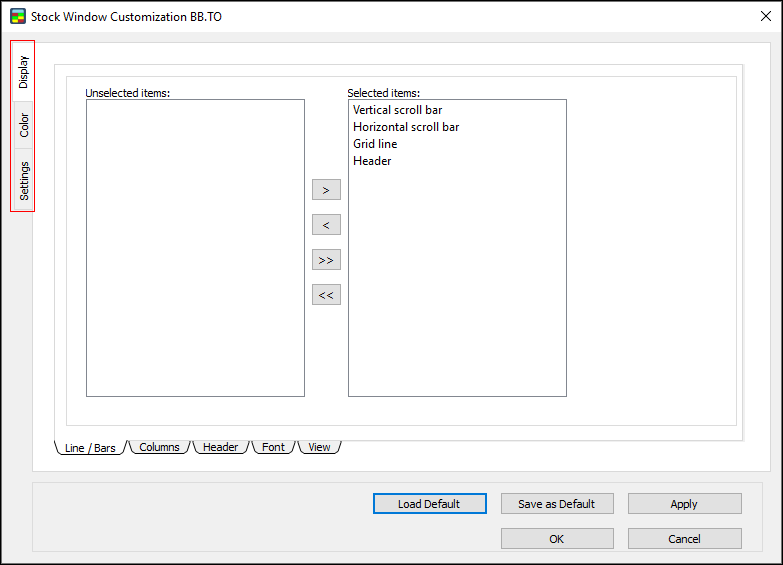
Display
Use the Display window to set the display settings for the Stock Window.
- Click the Display tab to open the Display window.
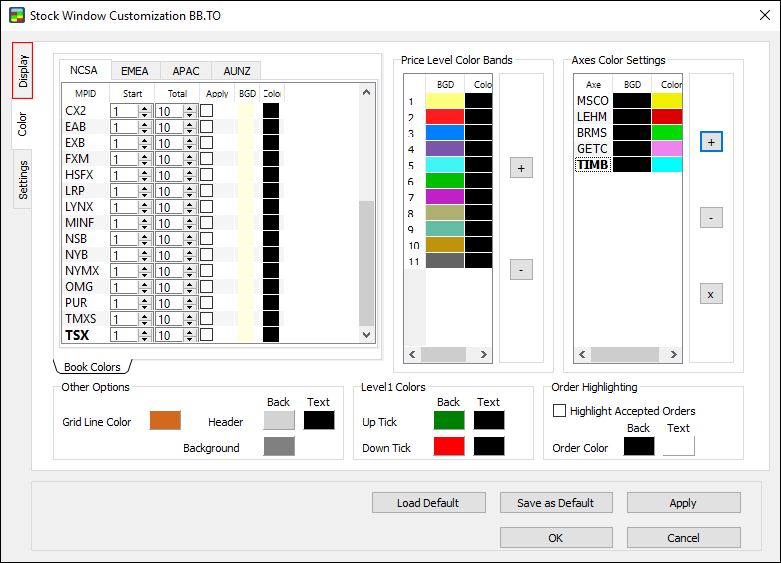
The Display window contains five sub-tabs: Line/Bars, Columns, Header, Font, and View.
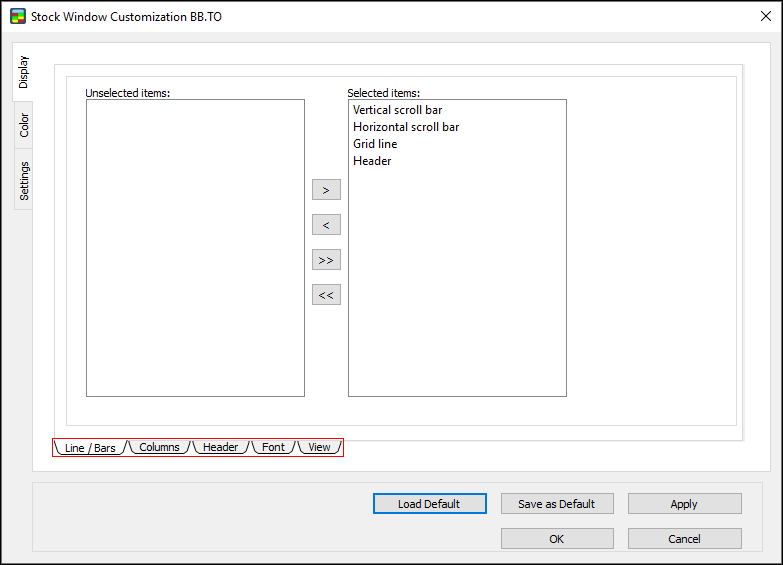
Line/Bars
Use the Line/Bars window to show or hide scroll bars, line, and the header.
1. Click the Line/Bars sub-tab in the Display window.

2. The Line/Bars window appears.
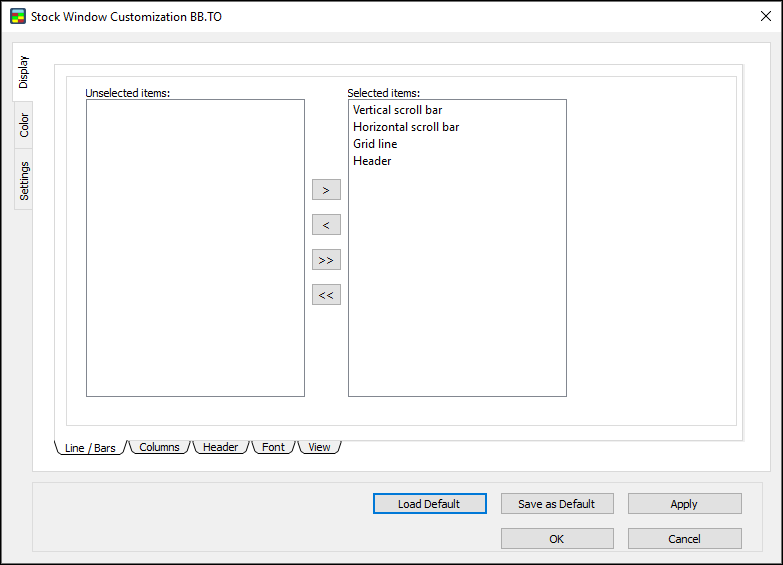
Show an item in the Stock Window
1. In the Line/Bars window, click an item in the Unselected items list.
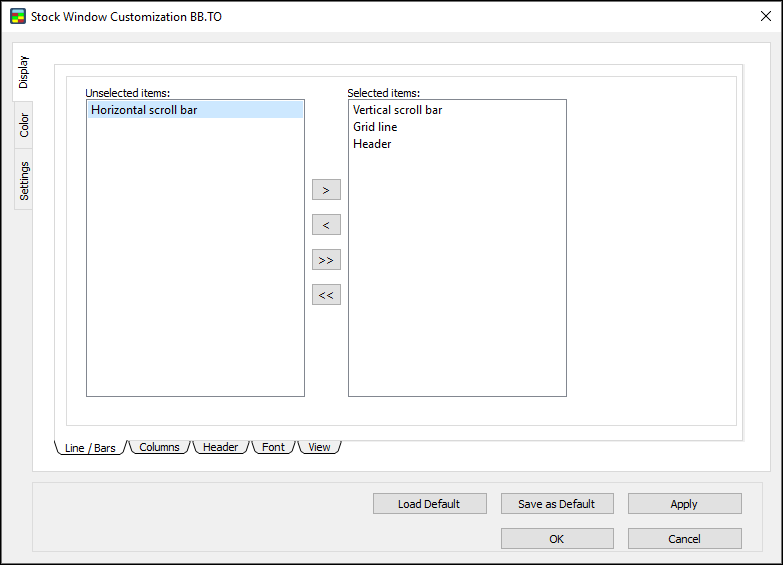
2. Click the right arrow to move the item to the Selected items list.
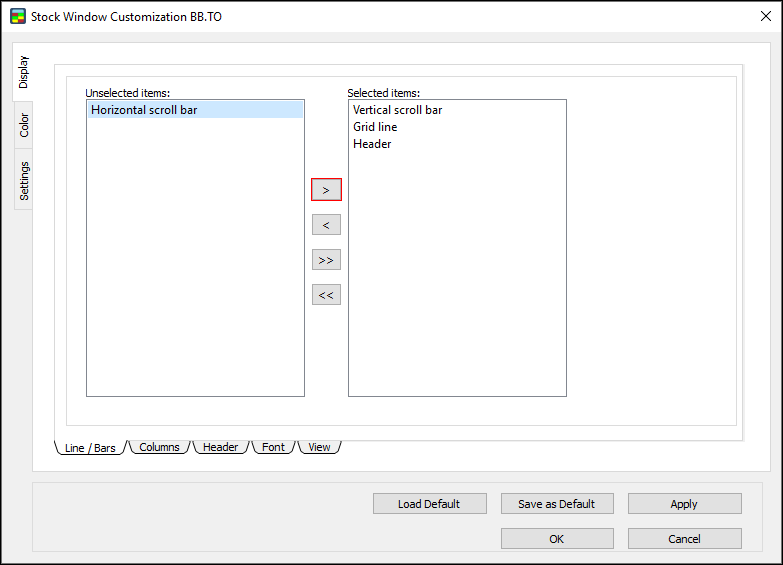
3. Click OK.
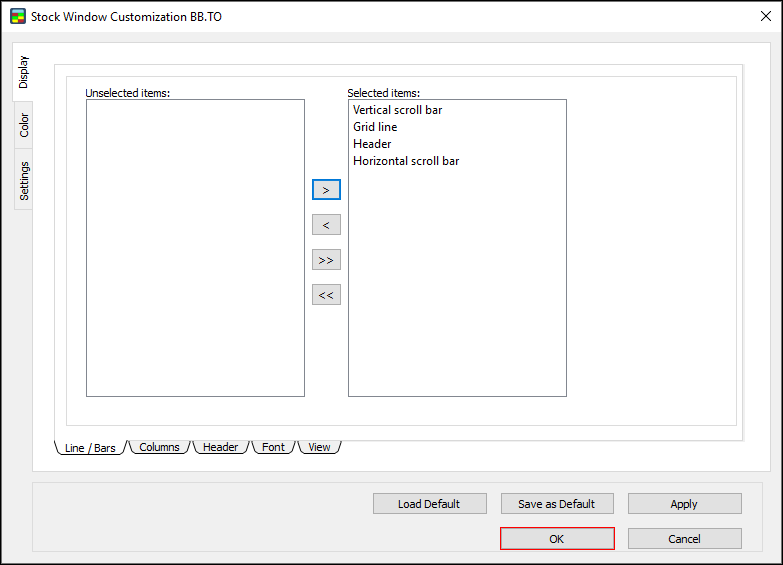
4. The item appears in the Stock Window.
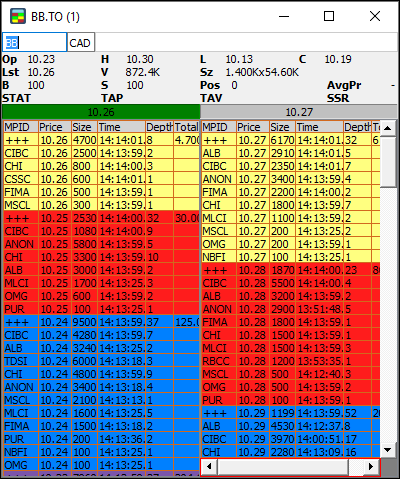
Hide an item from the Stock Window
1. In the Line/Bars window, click an item in the Selected items list.
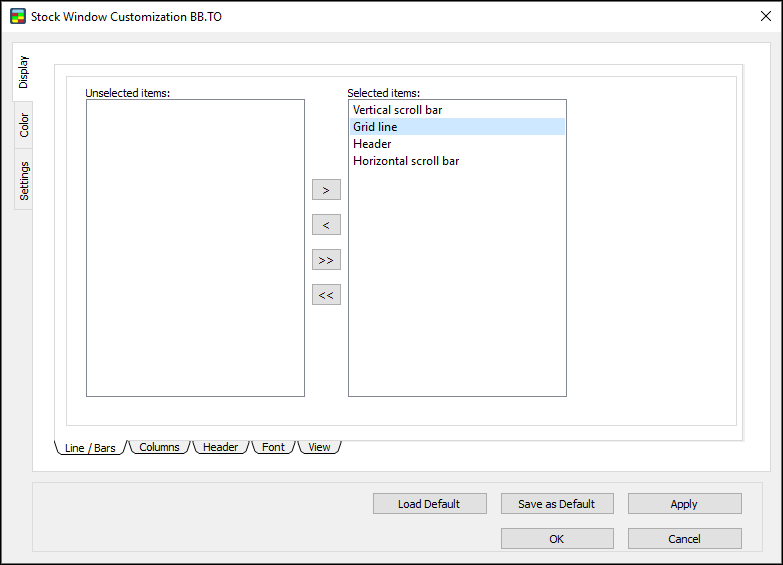
2. Click the left arrow to move the item to the Unselected items list.
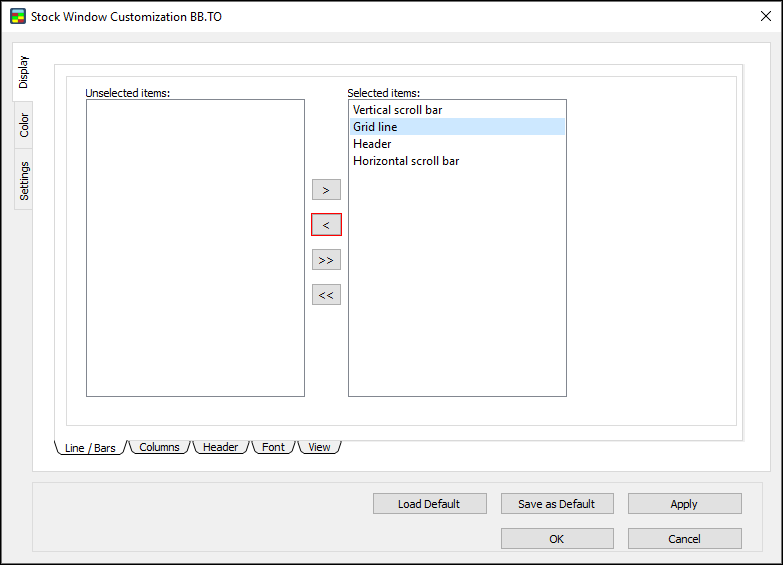
3. Click OK.
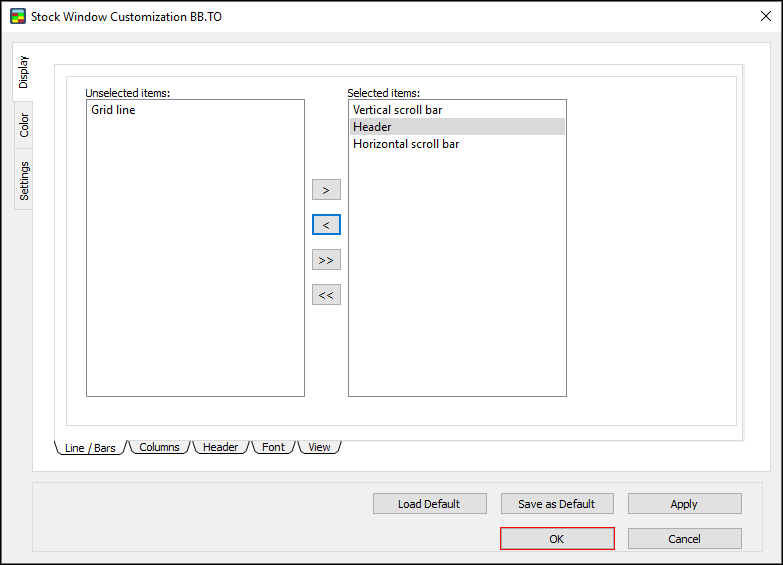
4. The item is hidden from the Stock Window.
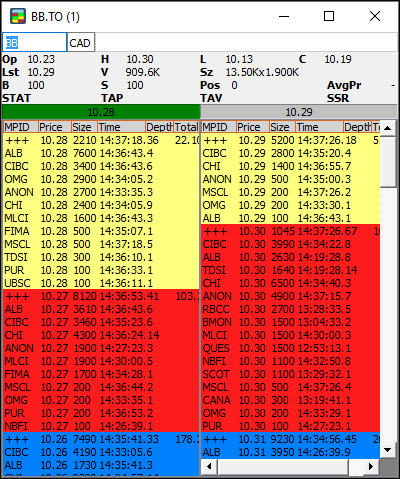
Columns
Use the Columns window to manage the columns that appear in Lv2.
1. Click the Columns sub-tab in the Display window.

2. The Columns window appears.
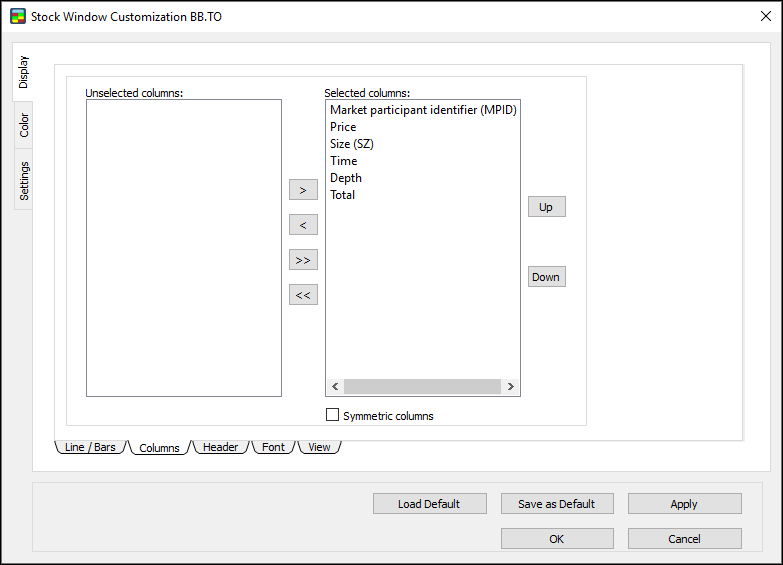
As in the above instructions for Line/Bars, all items moved to the Selected items side appear in the Stock Window, and all items moved to the Unselected items side are hidden, when the settings are applied.
Header
Use the Header window to manage the header rows that appear in Lv2.
1. Click the Header sub-tab in the Display window.

2. The Header window appears.
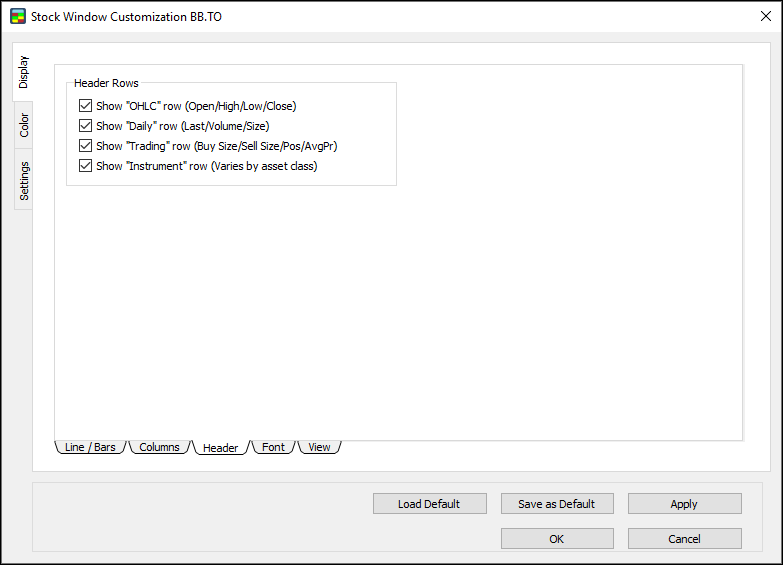
3. Select or clear the check boxes to show or hide the various Header Rows (OHLC, Daily, Trading, Instrument).
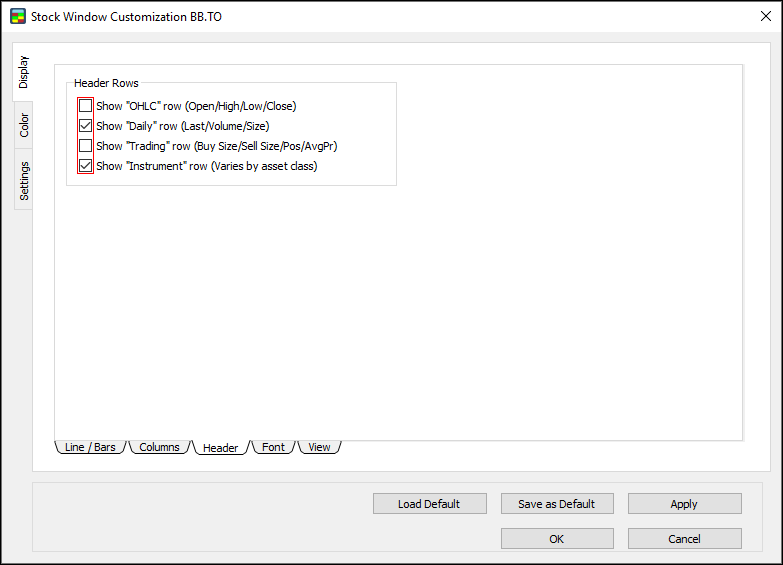
4. Click OK.
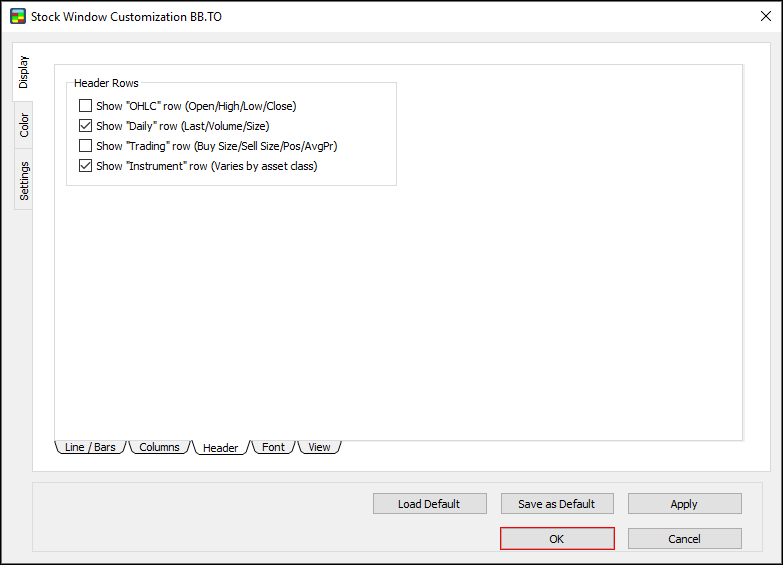
5. The Stock Window appears with the selected rows shown and the cleared rows hidden.
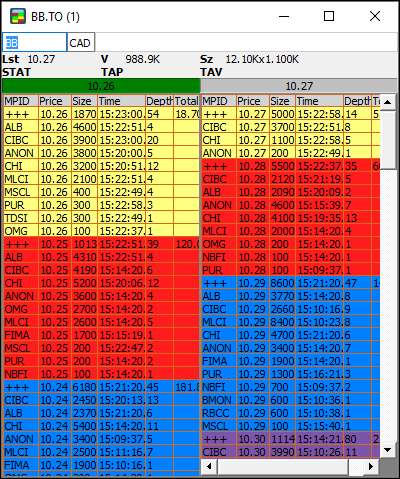
Font
Use the Font window to set the overall font for the Stock Window.
Set a font for the Stock Window
1. In the Display window, click the Font sub-tab.

2. The Font window appears.
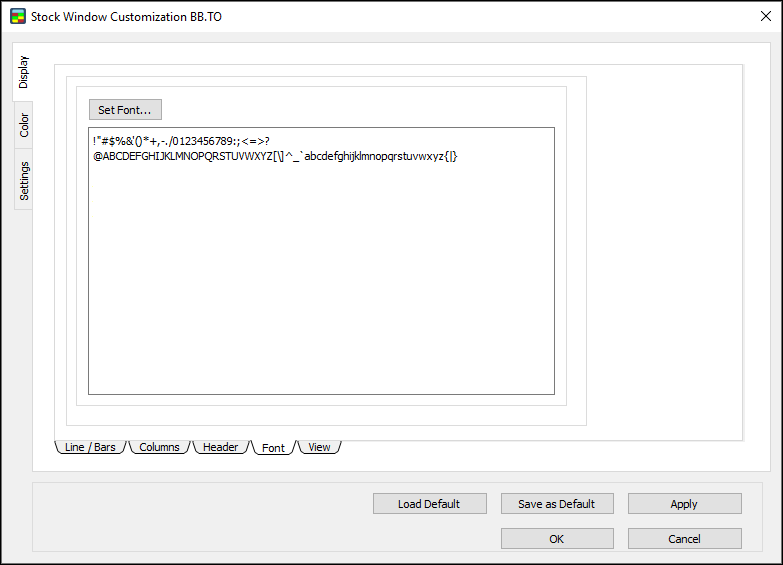
3. Click Set Font….
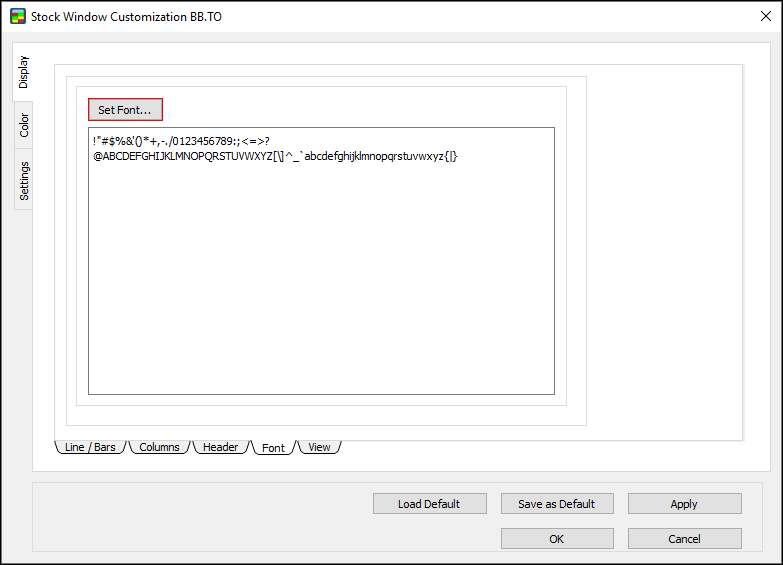
4. The Select Font window appears.
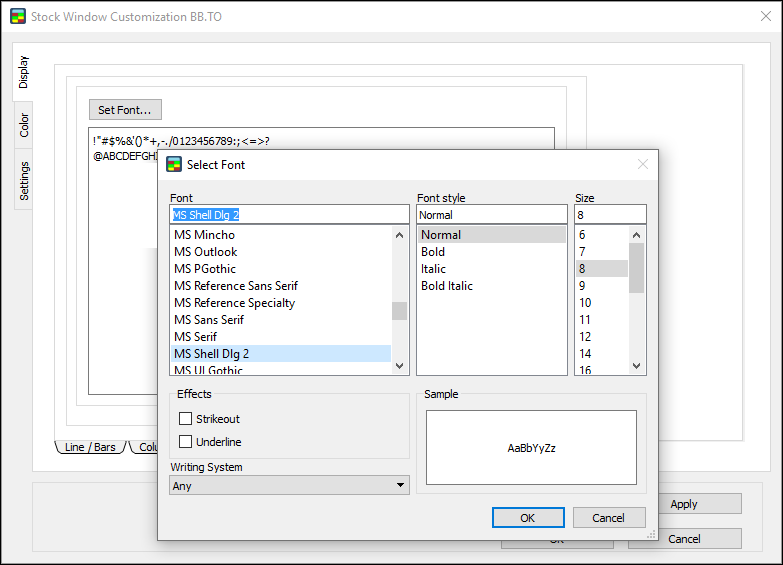
5. Click the font, font style, size, effects, and writing system you want to set.
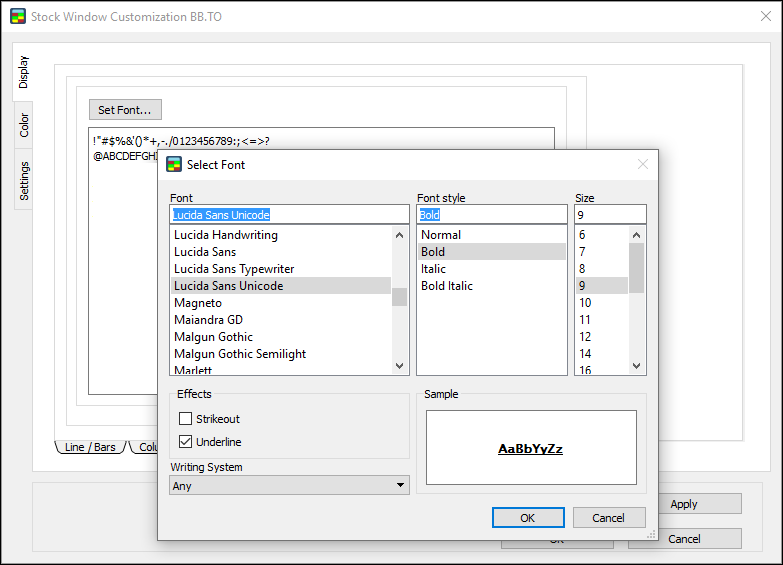
6. Click OK.
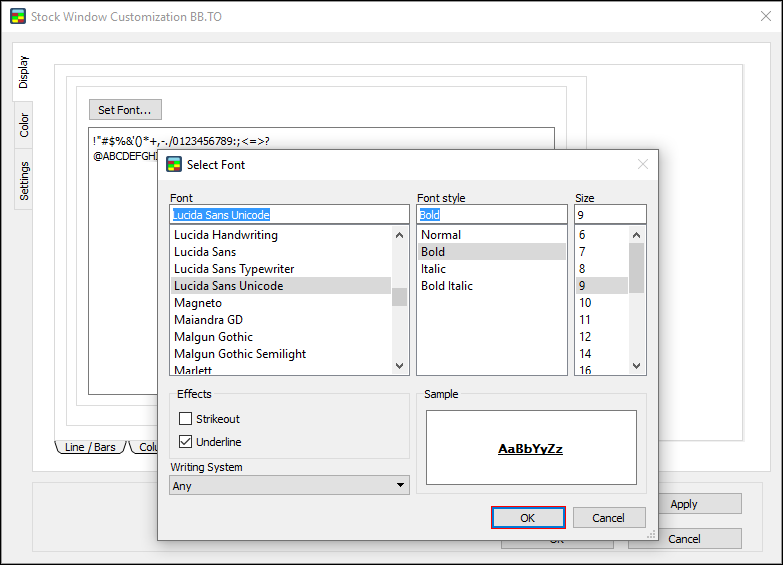
7. Click OK.
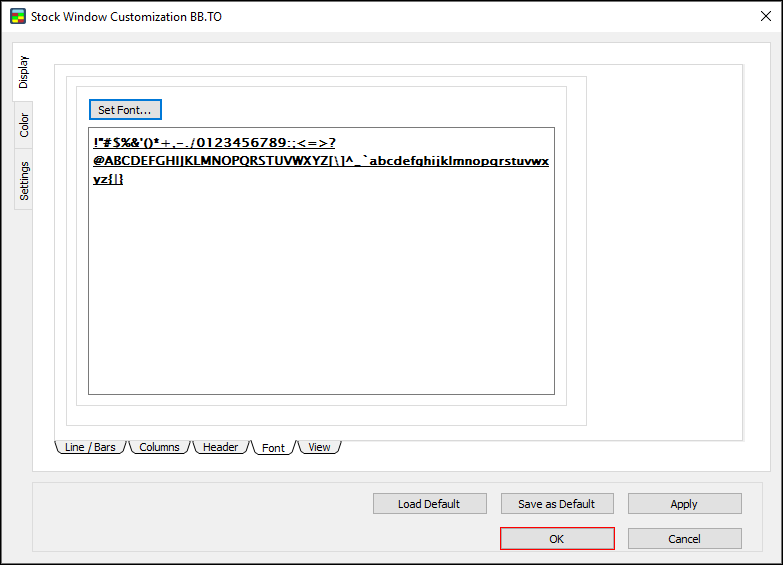
8. The new font appears in the Stock Window.
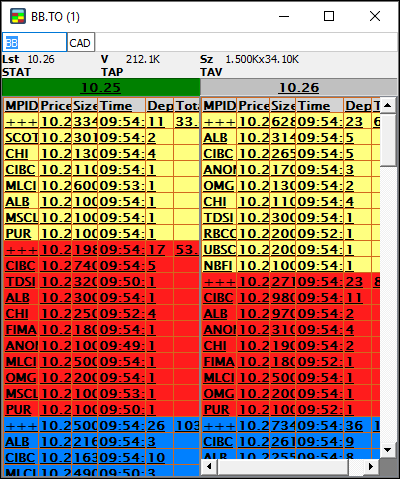
View
Use the View window to set the view type for the Stock Window.
Set a view for the Stock Window
1. In the Display window, click the View sub-tab.

2. The View window appears.
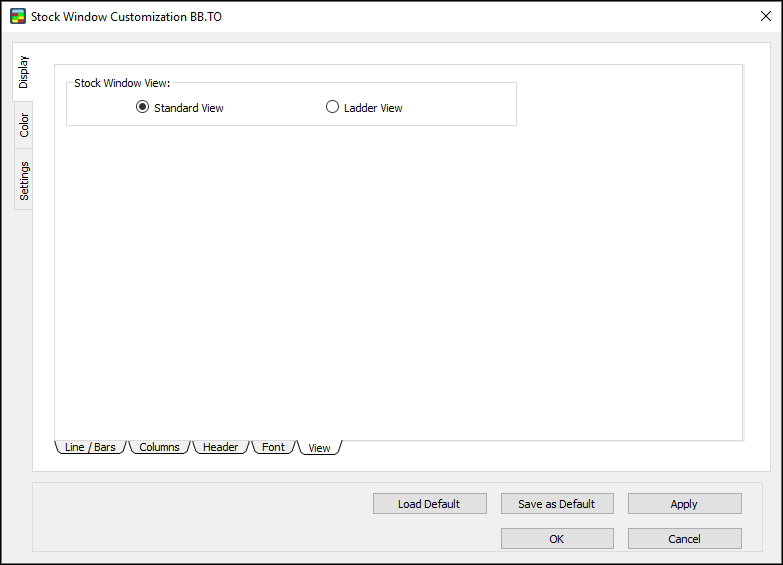
3. Click Ladder View to set the ladder view for the Stock Window.
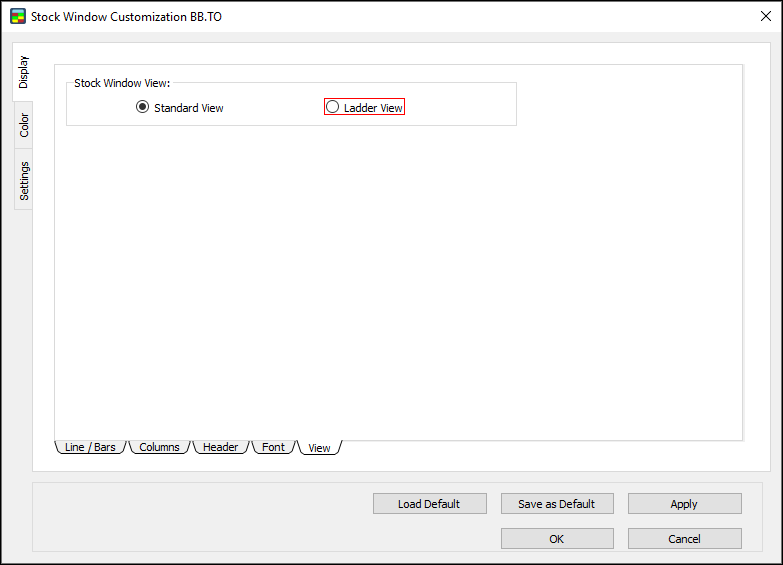
4. Click OK.
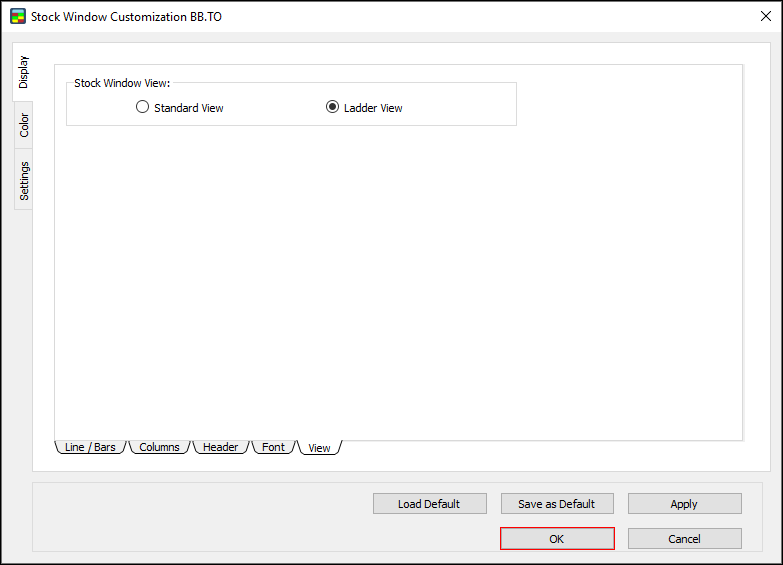
5. The Stock Window appears in ladder view.
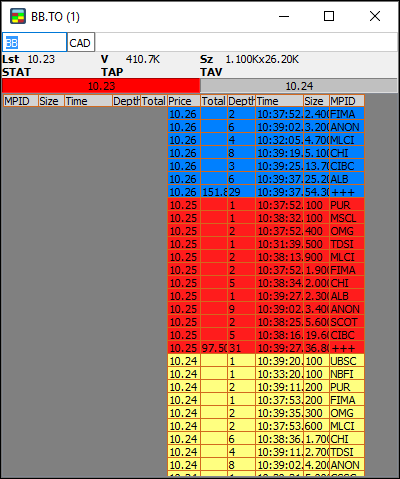
6. Return to the View window and click Standard View to set the standard view for the Stock Window.
7. Click OK.
8. The Stock Window appears in standard view.

Color
Use the Color window to set the colors, which books to show, and how many levels to show in the Stock Window.
1. Click the Color tab.
2. The Color window appears.
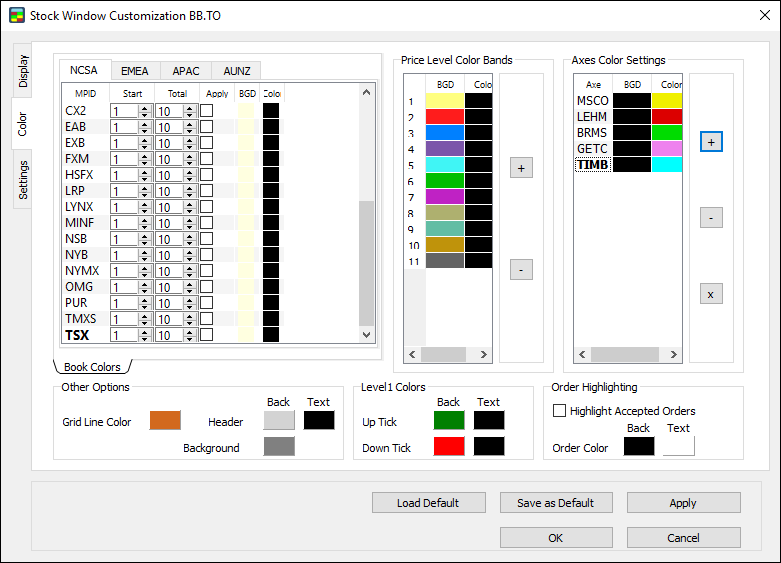
Set book color
1. In the Color window, click the region tab for the region you want to set colors for (NCSA, EMEA, APAC, or AUNZ).
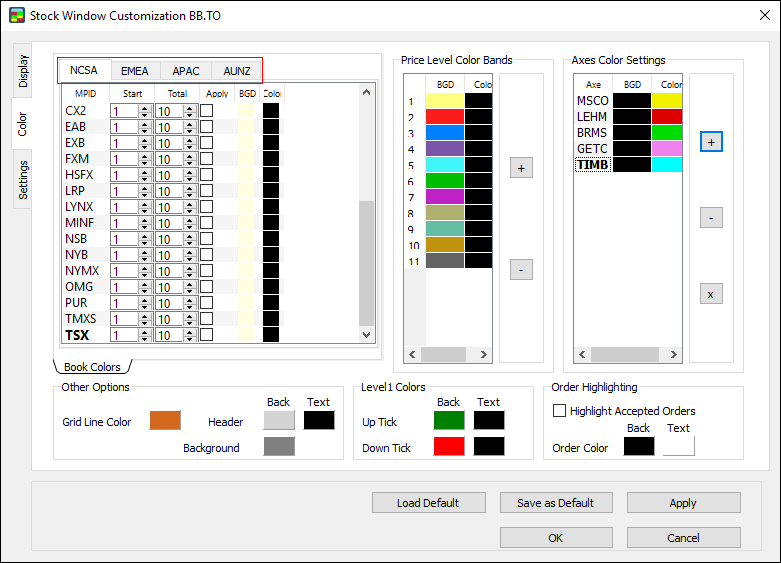
2. Select the check box under the Apply column heading for the book you would like to set a color for.
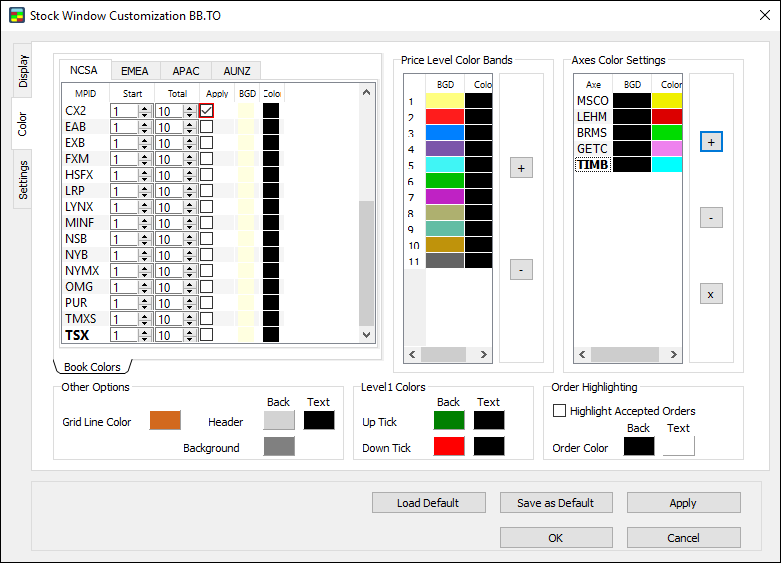
3. Double-click the color boxes under the BGD (for background) and Color (for foreground) column headings.
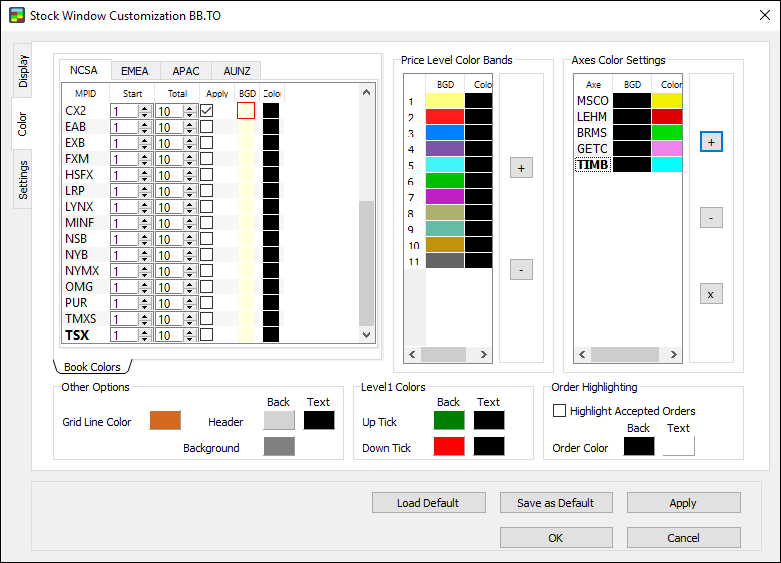
4. The Color Selector window appears. Click a color, and then click OK.
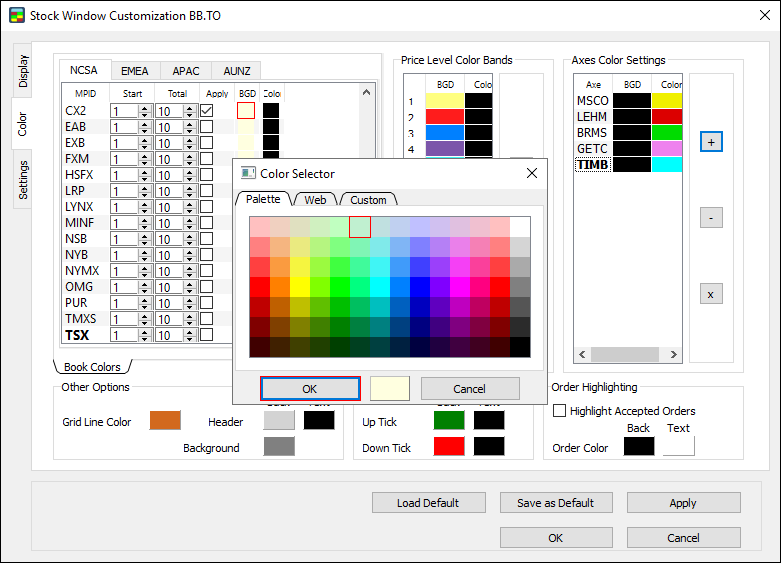
5. In the Color window, click OK.
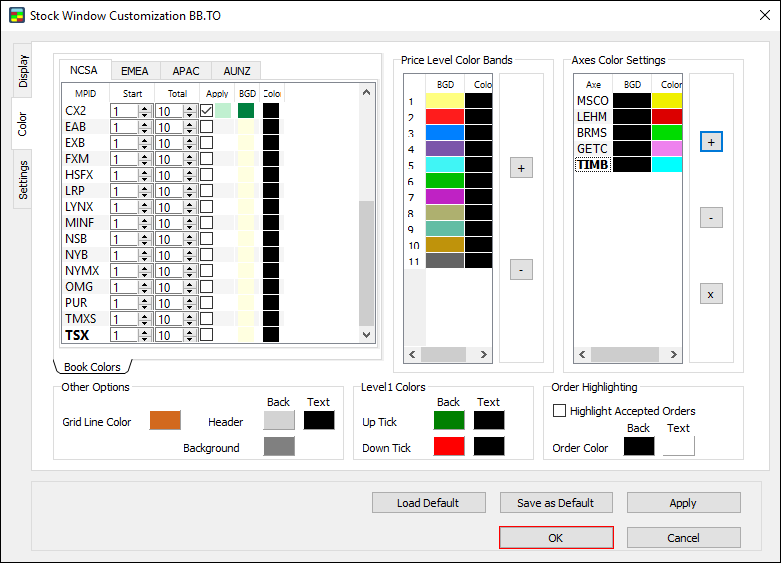
6. The book color is set.
Set number of price levels
1. In the Color window, click the arrows under the Start and the Total columns to set the number of price levels to be consolidated (+++) for each book. Setting Total to 0 hides the book.
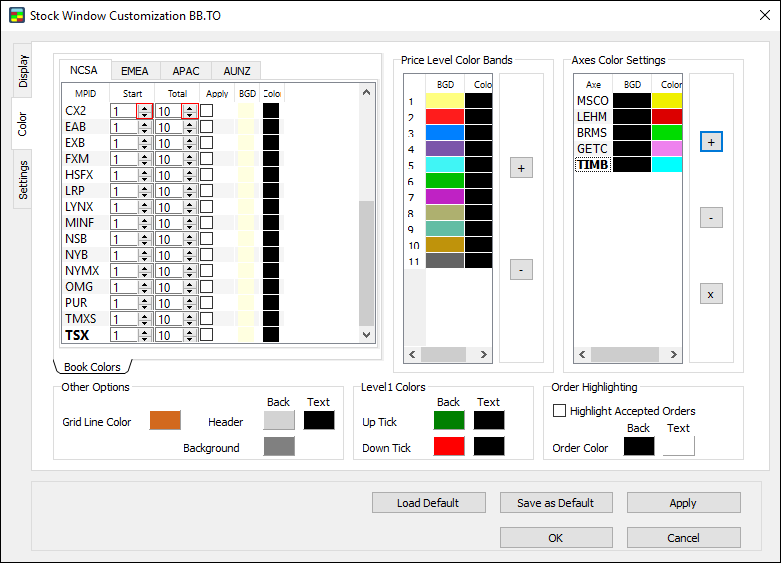
2. Click OK.
3. The adjusted levels appear in the Stock Window.
Set Price Level Color Bands
1. In the Color window, under Price Level Color Bands, double-click the color boxes under the BGD (for background) and Color (for foreground) column headings.
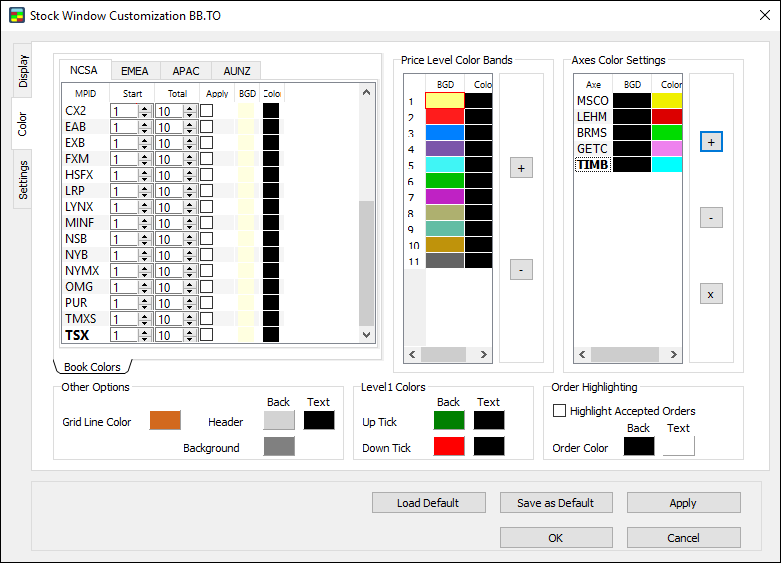
2. The Color Selector window appears. Click a color, and then click OK.
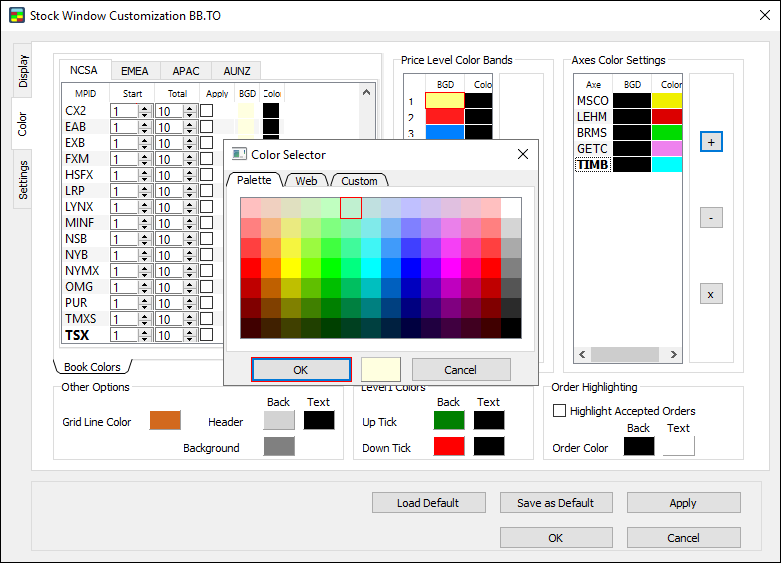
3. Click OK.
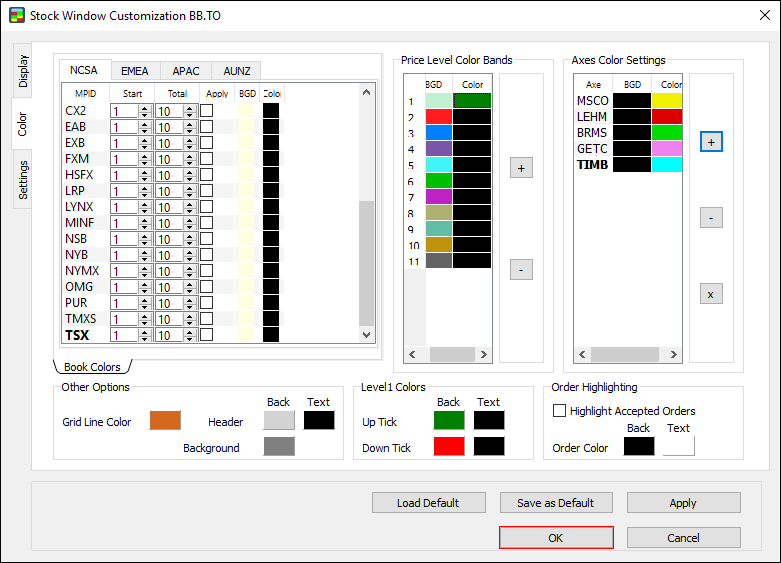
4. The colors are set for the price level band.
Adjust Axes Color Settings
1. In the Color window, under Axes Color Settings, double-click the color boxes under the BGD (for background) and Color (for foreground) column headings.
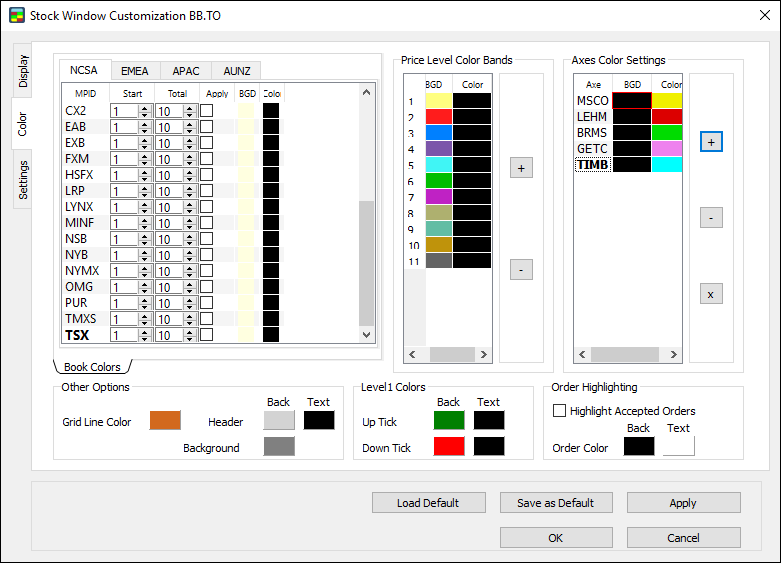
2. The Color Selector window appears. Click a color, and then click OK.
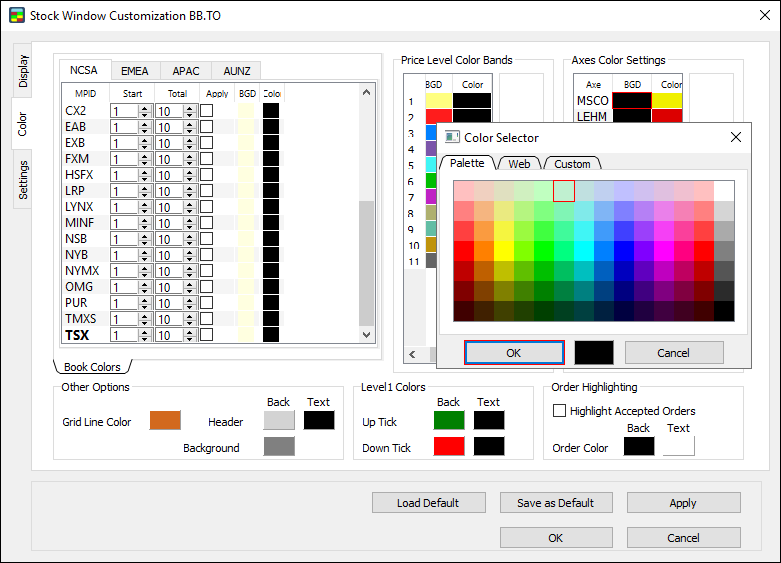
3. Click OK.
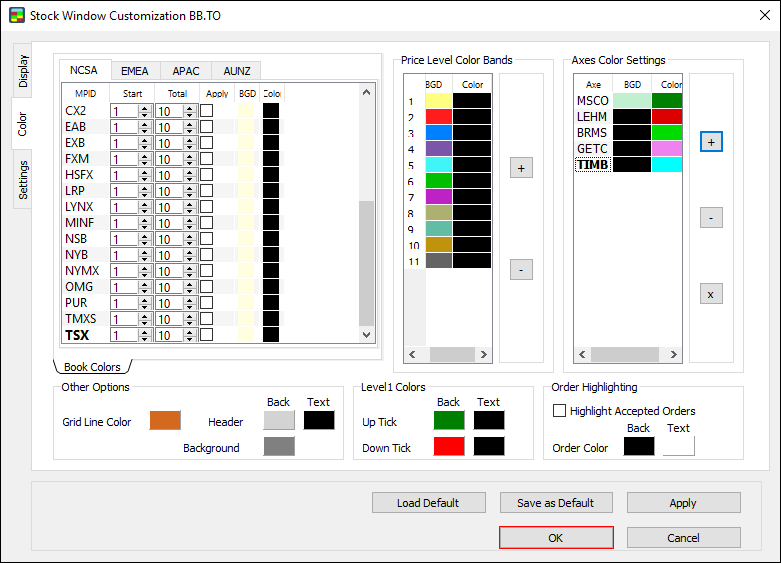
4. The colors are set for the axe.
Set Other options
1. In the Color window, double-click the color box next to Grid Line Color.
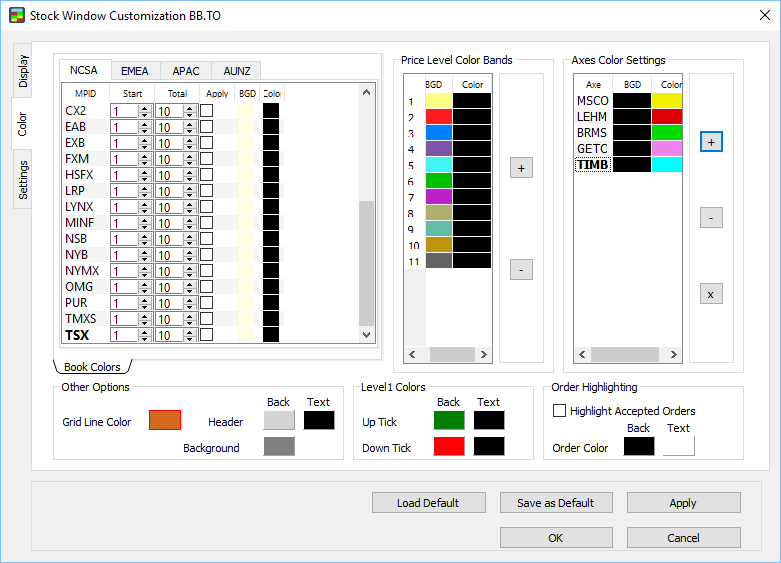
2. The color window appears. Click a color, and then click OK.
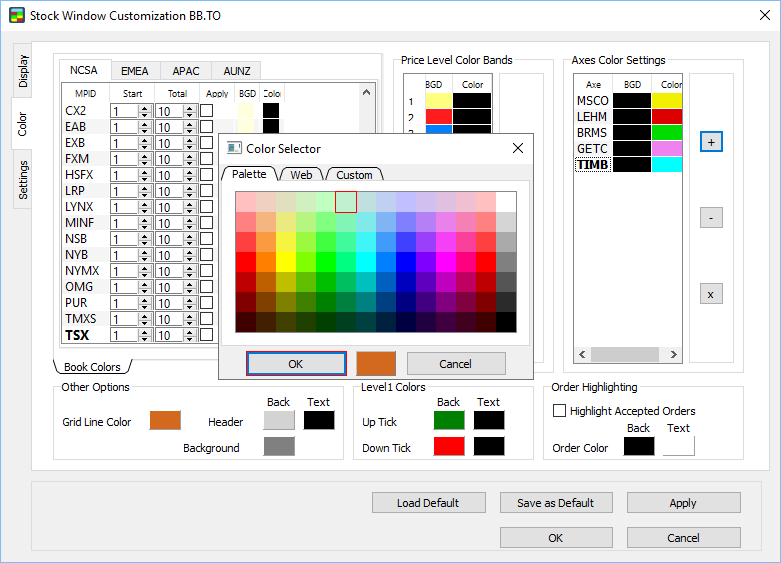
3. Similarly, click the colors for the Header and Background (Back and Text) color boxes, as needed.
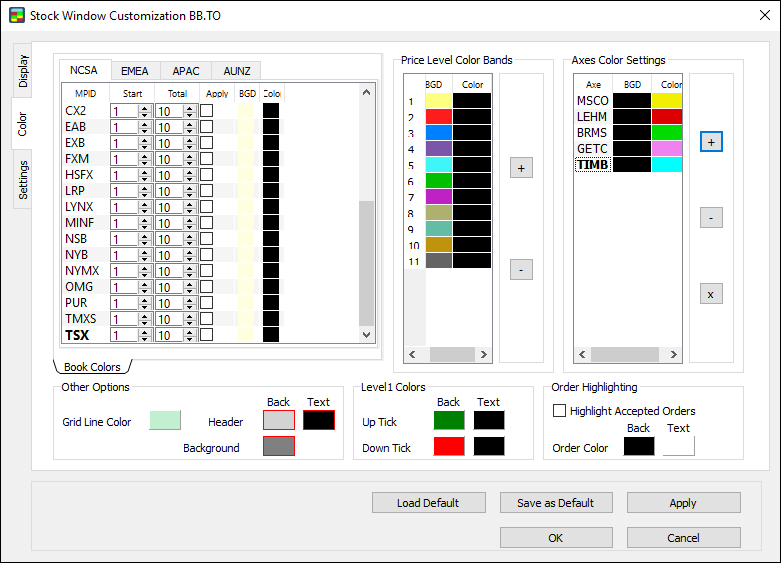
4. Click OK.
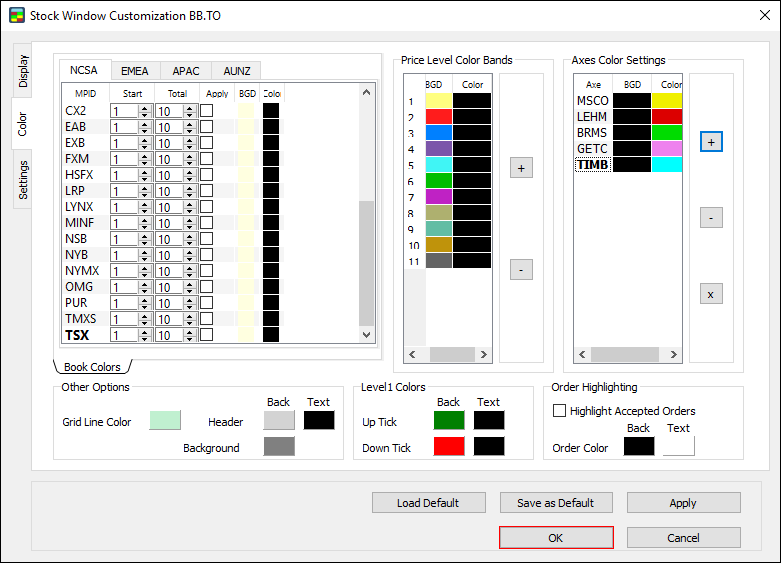
5. The colors are set for the grid line and header.
Set Level1 Colors
1. In the Color window, under Level1 Colors, double-click the Back (for background) color box next to Up Tick or Down Tick.
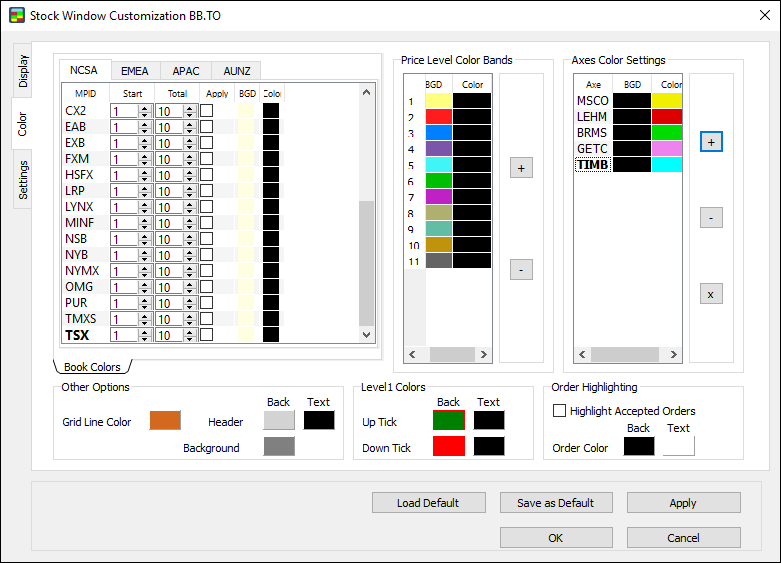
2. The Color Selector window appears. Click a color, and then click OK.
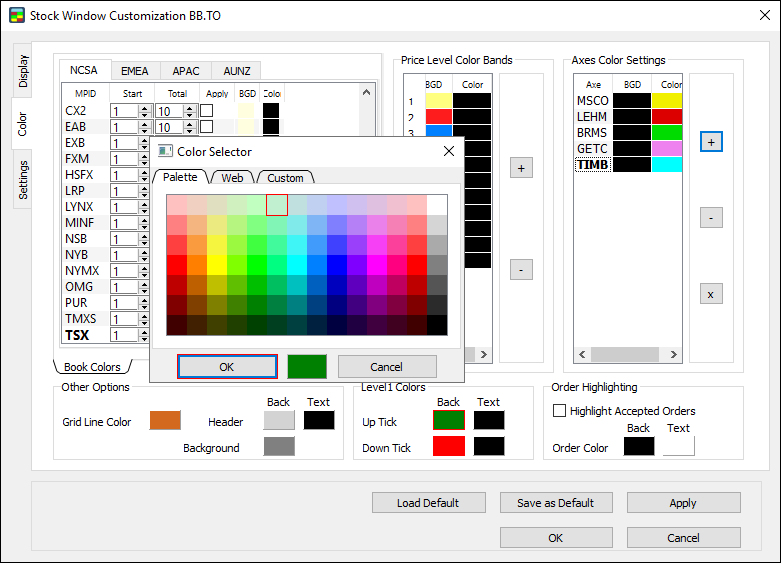
3. Similarly, click the color for the Text color boxes.
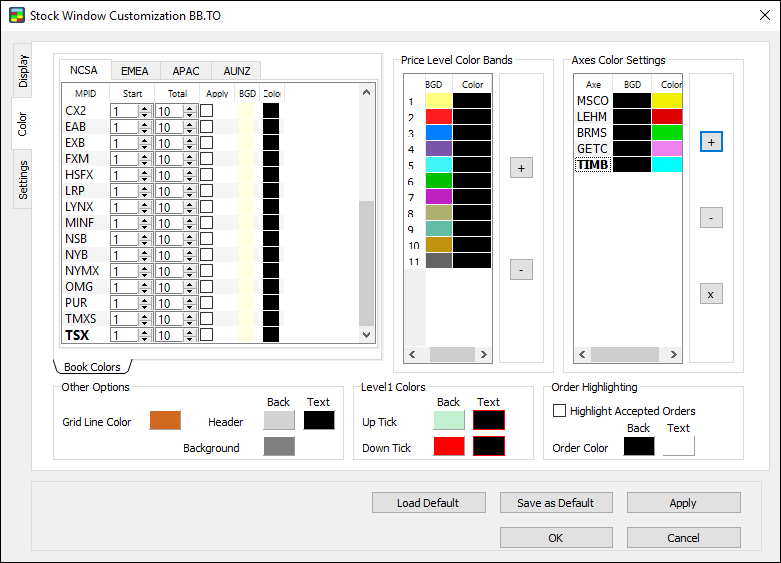
4. Click OK.
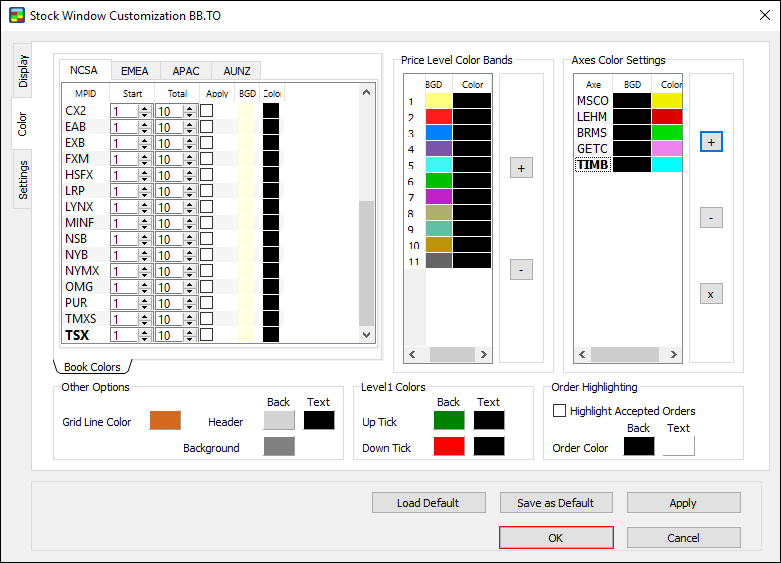
5. The colors are set for Level1 uptick and downtick.
Set Order Highlighting
1. In the Color window, under Order Highlighting, select the Highlight Accepted Orders check box.
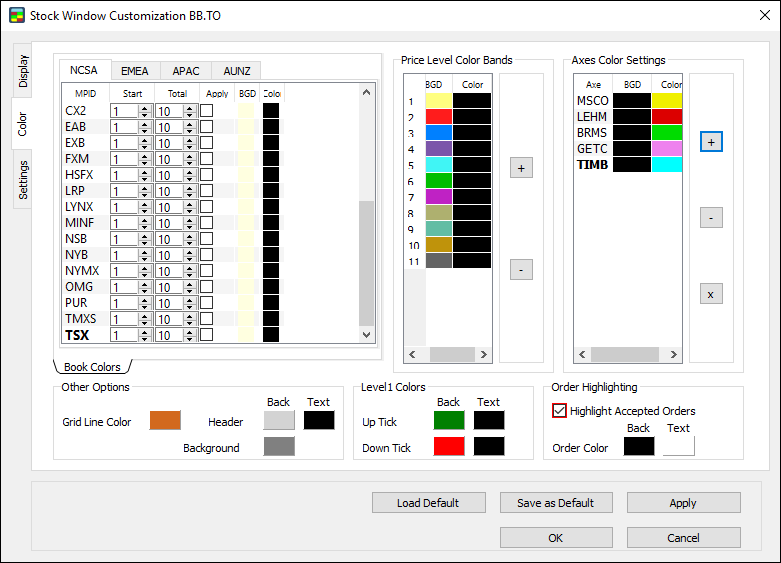
2. Double-click the color boxes under the Back (for background) and Text (for text) column headings, as needed.
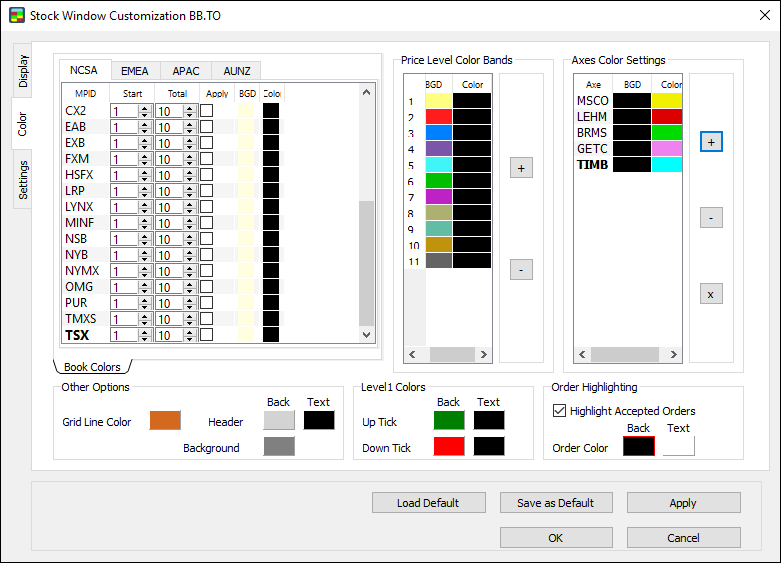
3. The Color Selector window appears. Click a color, and then click OK.
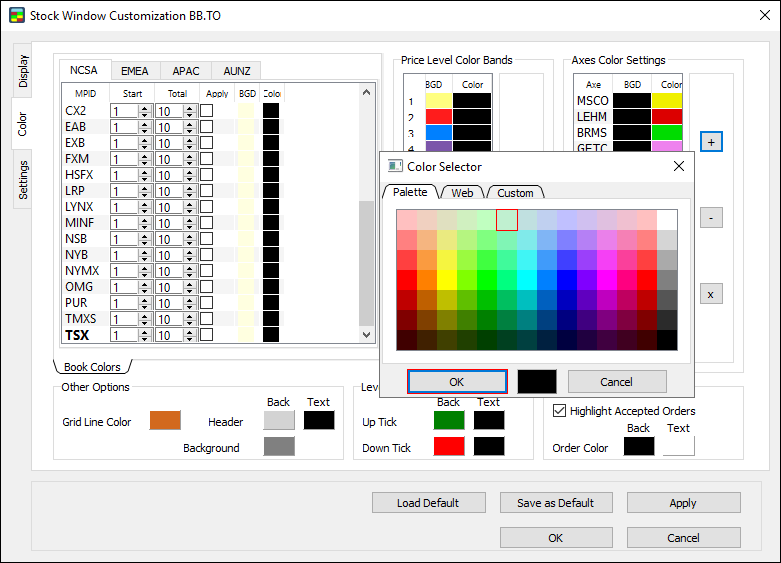
4. Click OK.
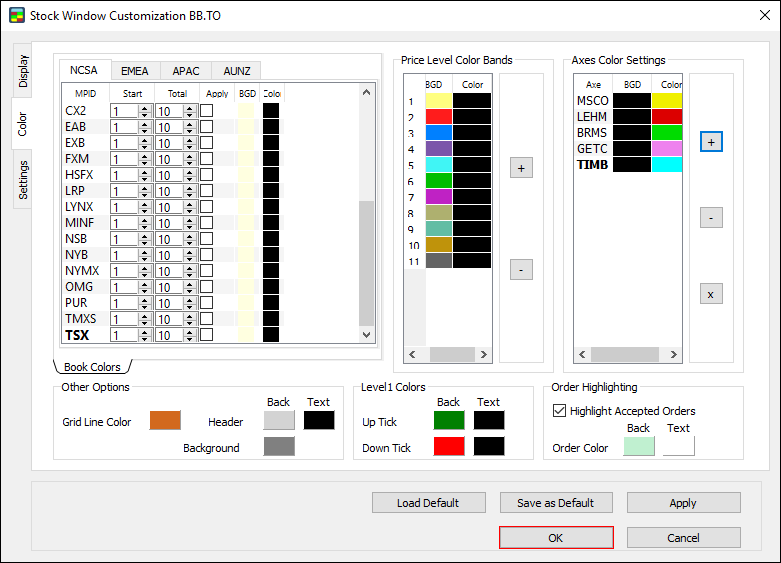
5. Order highlighting is set. You can now see at which price levels your orders are accepted.
Note: make sure to set Order highlighting before starting your trading activity. The Stock Window won’t highlight orders made prior to setting Order highlighting.
Settings
Use the Settings window to set window options, global options, and size for the Stock Window.
- Click the Settings tab to open the Settings window.
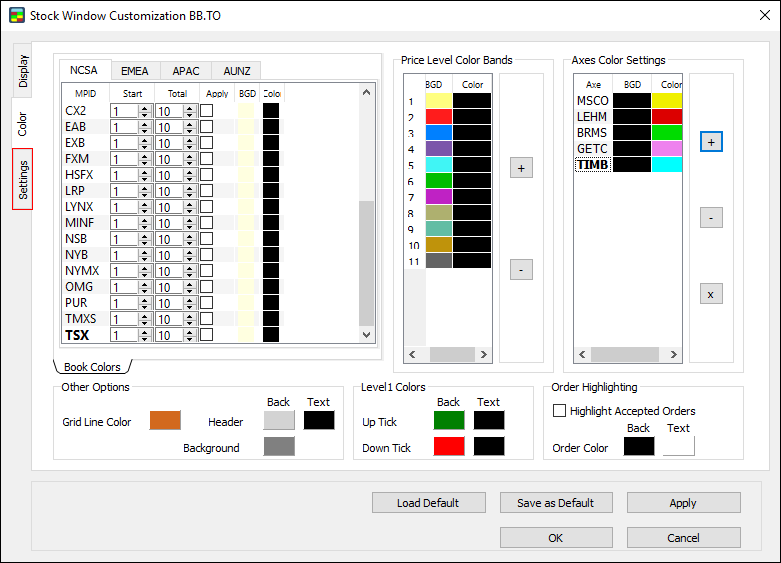
The Settings window contains three sub-tabs: Window Options, Global Options, and Size.
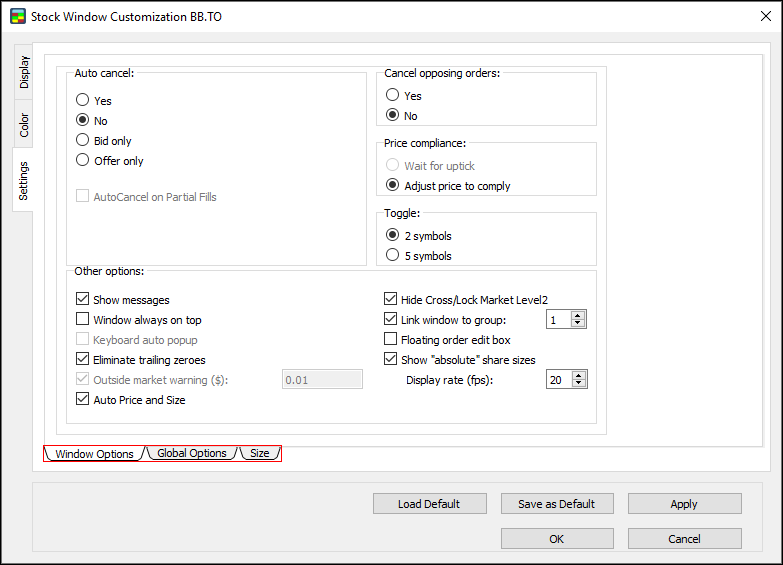
Window Options
Use the Window Options window to set the rest of the available customization options.
- Click the Window Options sub-tab to open the Window Options window.
Set Auto Cancel
- In the Window Options window, under Auto cancel, click Yes, No, Bid only, or Offer only to set the auto cancel options:
- Yes: if this option is clicked, the auto cancel functionality turns on. When an order is filled, any existing parallel order must be cancelled.
- No: if this option is clicked, the auto cancel functionality turns off.
- Bid only: if this option is clicked, when a Buy order is filled, any Bid on the symbol must cancel.
- Offer only: if this option is clicked, when a Sell order is filled, any Bid on the symbol must cancel.
- AutoCancel on Partial Fills: this option becomes available for selection when the AutoCancel option turns on (that is, after clicking Yes, Bid only, or Offer only).
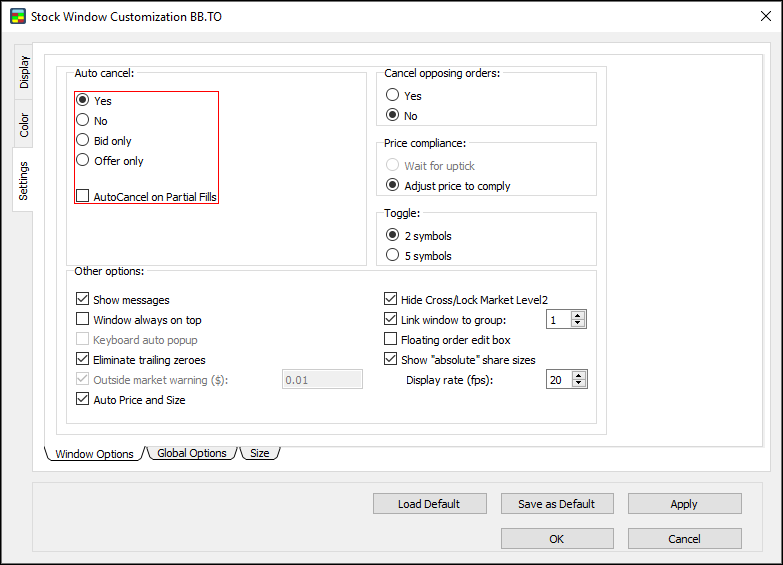
Cancel opposing orders
- If Yes is clicked, this option sends a cancel on all opposing orders at a locked or crossed price when a new order is placed.
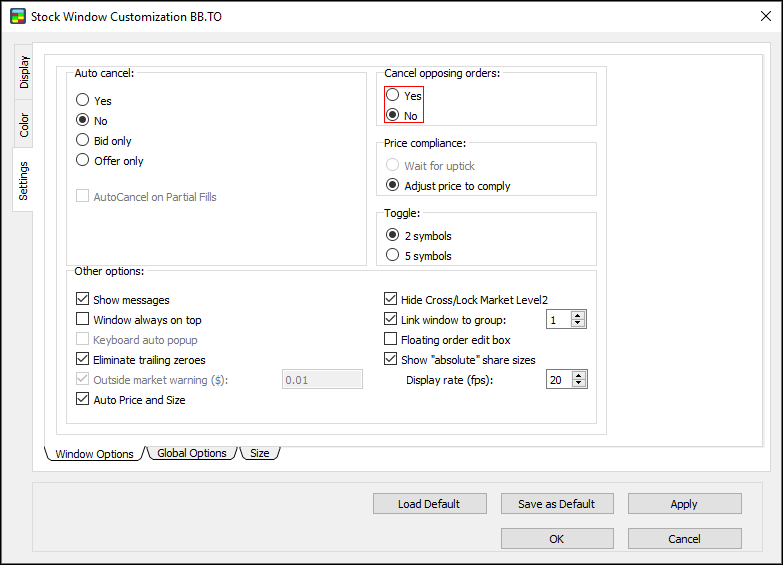
Set Price compliance
- Wait for uptick: this option is automatically set to unavailable.
- Adjust price to comply: this option is automatically set to round up to the appropriate tick size. For example, if a price can be typed as $10.125–$10.13, and you type $10.127, the number is automatically rounded to $10.13.
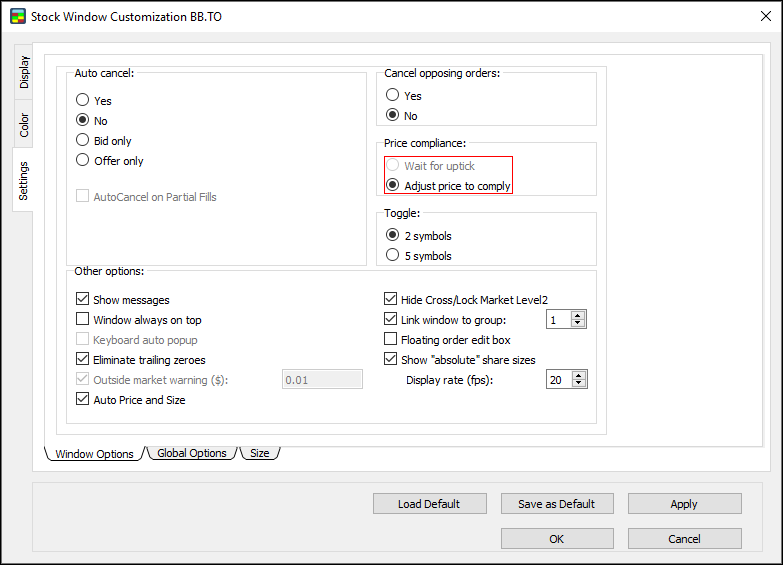
Set Toggle
- 2 symbols: if this option is clicked, the Stock Window retains two symbols for toggling when you press the Page Up or Page Down key.
- 5 symbols: if this option is clicked, the Stock Window retains five symbols for toggling when you press the Page Up or Page Down key.
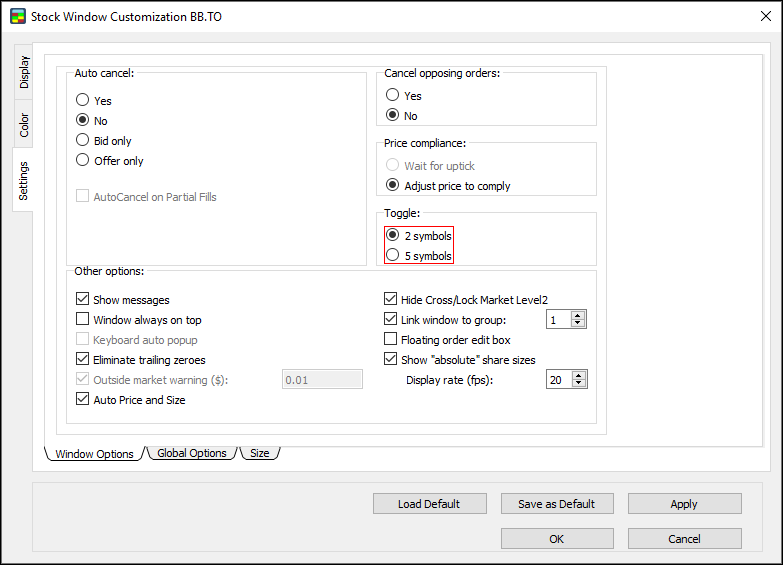
Set Other options
- In the Window Options window, under Other options, select the check boxes to set the following options:
- Show messages: if this option is selected, all order messages appear in the Messages box.
- Window always on top: if this option is selected, the Stock Window will be open on top of other windows at all times.
- Eliminate trailing zeroes: if this option is selected, any zeroes that trail the price on both Lv1 and Lv2 data are hidden. For example, “15.9700” appears as “15.97”.
- Auto Price and Size: if this option is selected, you can click a Lv2 Price, or Lv2 Total, and have the corresponding values applied to the Order Edit Box.
- Hide Cross/Lock Market Level2: if this option is selected, crossed/locked markets are hidden in Lv2.
- Link window to group: if this option is selected, the Stock Window is grouped with other tools, such as the Chart Window and the TOS Window. Other windows in the window group of the same number change their symbol to correspond to the symbol in the Stock Window.
- Floating Order Edit Box: if this option is selected, the Order Edit Box detaches from the Stock Window for positioning anywhere on the screen.
- Show “absolute” share sizes: if this option is selected, the true size of a book appears, showing odd lots when they are present. This does not apply to Lv1 size in the header.
- Display rate (fps): click or type a number to set the display rate in frames per second.
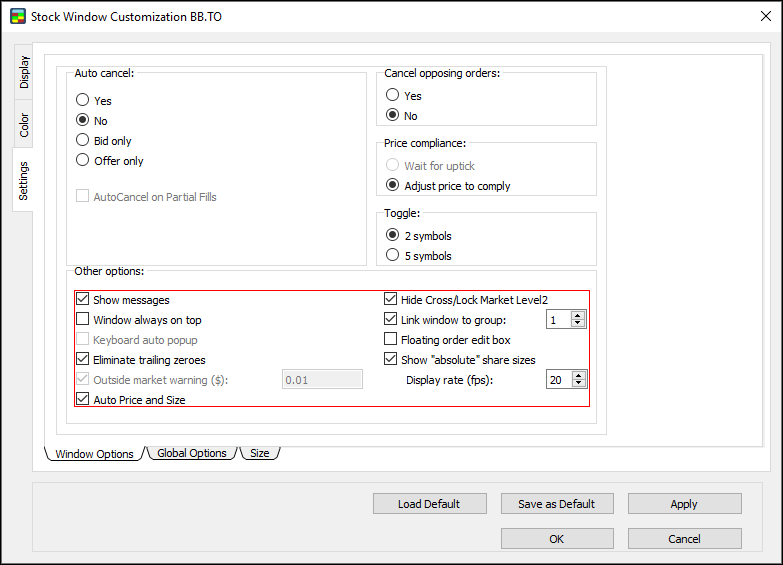
Note: selecting the Show absolute share sizes check box displays the actual share sizes on various ECNs, with zeroes. Clearing the Show absolute share sizes check box displays the sizes divided by 100. For example:
- 1100 shares on TSX are pending
- Clear the Show absolute share sizes check box: the number 11 (which is equal to 1100/100) appears
- Regardless of the check box, Volume (V) and Size (Sz) values always use the absolute share sizes
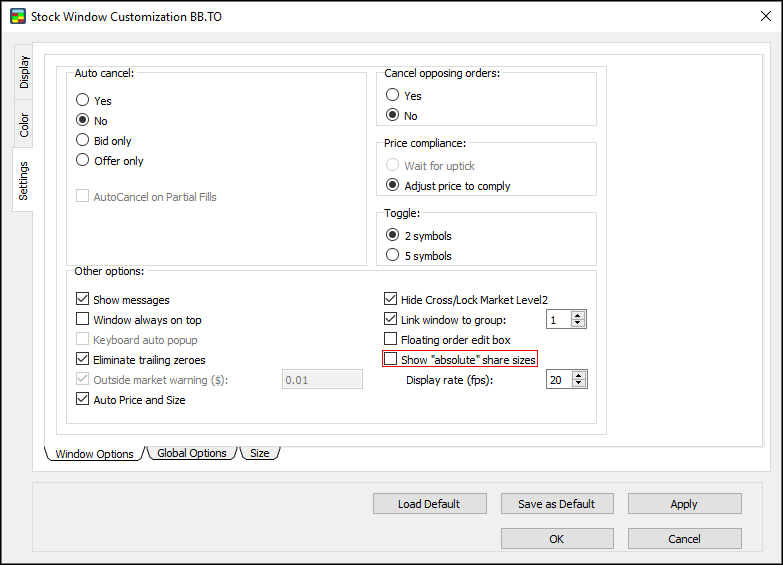
Note: The Show absolute share sizes option is not compatible with futures. Also, Lv2 uses multipliers, namely: thousands (K) and millions (M).
Global Options
Use the Global Options window to set the Lv2 switching option.
- Click the Global Options sub-tab to open the Global Options window.
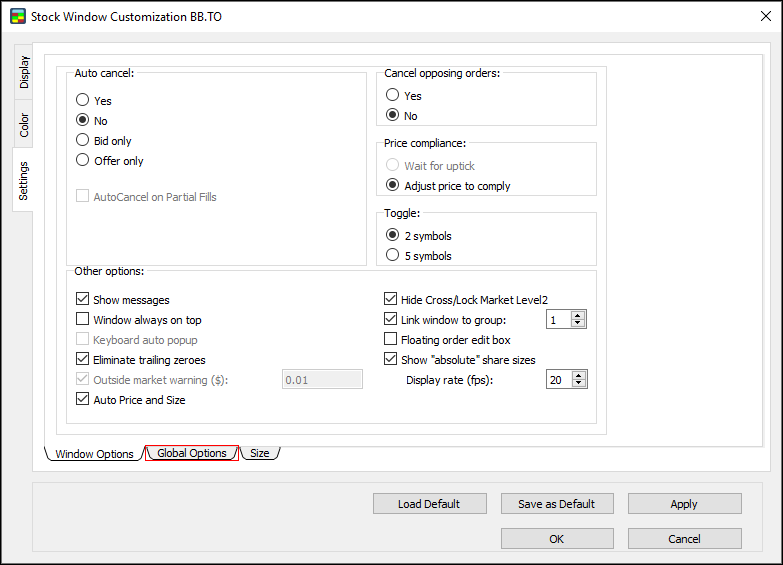
Set switching for level 2
- Right, left for active level 2 switching: if this option is Enabled, clicking the Right and Left Arrow keys moves between multiple Stock Windows.
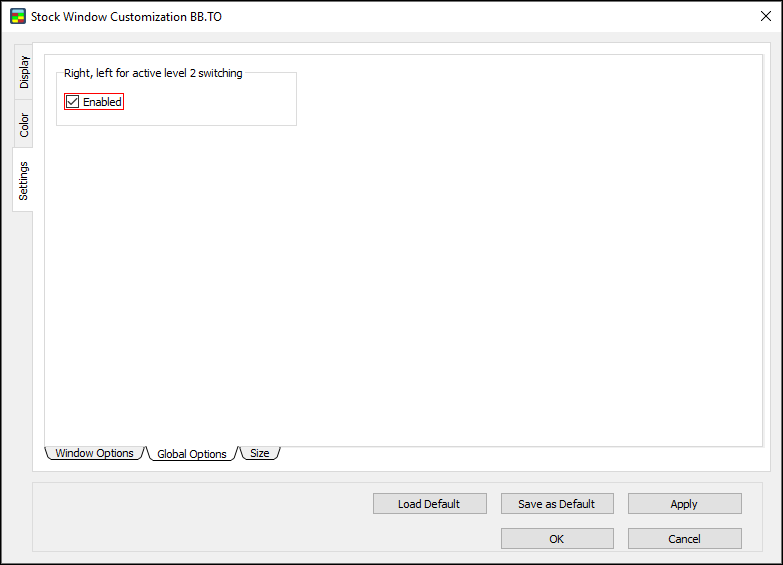
Size
Use the Size window to apply size defaults.
- Click the Size sub-tab to open the Size window.
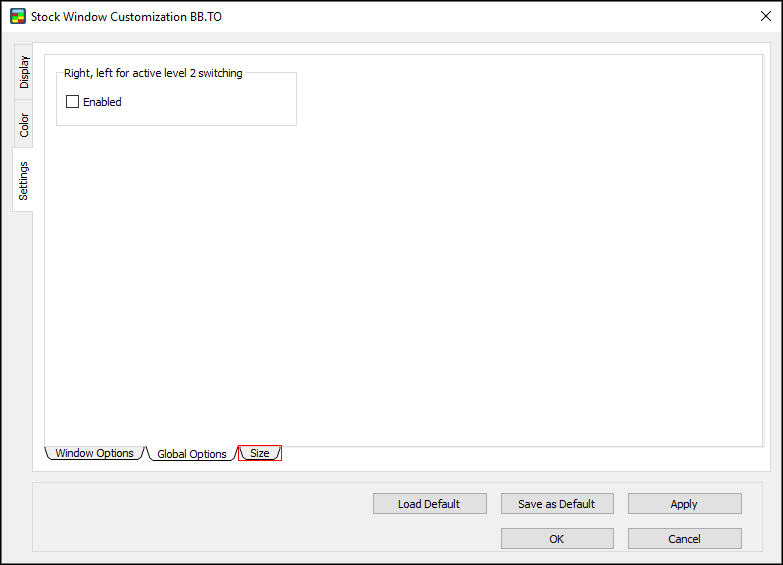
Apply size defaults
- Click the Apply size defaults menu to apply defaults by:
- Symbol: if this option is clicked, the default order size applies to all orders on a certain symbol.
- Window: if this option is clicked, the default order size links to a certain window, but symbols open in other windows are not affected.
- Click a column heading to sort alphabetically or by size.
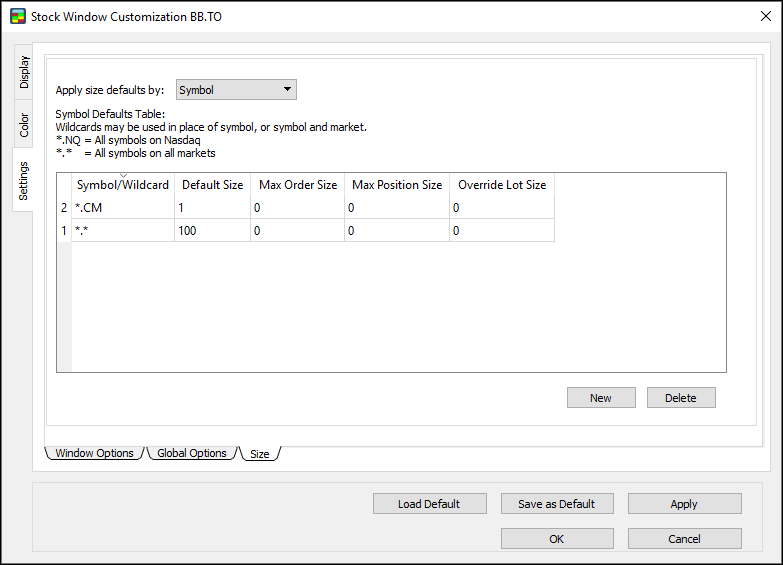
Set symbol defaults
Use the symbol defaults table to set the default order size, maximum order size, and maximum position size for a certain symbol or wildcard.
New: the symbol defaults table now syncs across all open instances of the Stock Window. Simply press a hotkey for an order, and then press Ctrl + NumPad to set the share size. The next time you open Customization for an open instance, the table will be populated with a new row for each symbol.
Add or delete new size defaults by symbol
1. Click Symbol, and then click New.
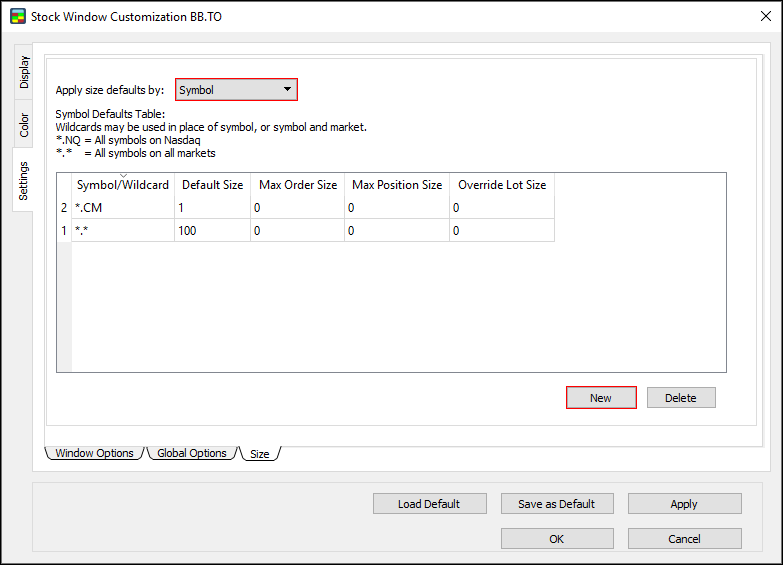
2. The Add new size defaults by symbol window appears.
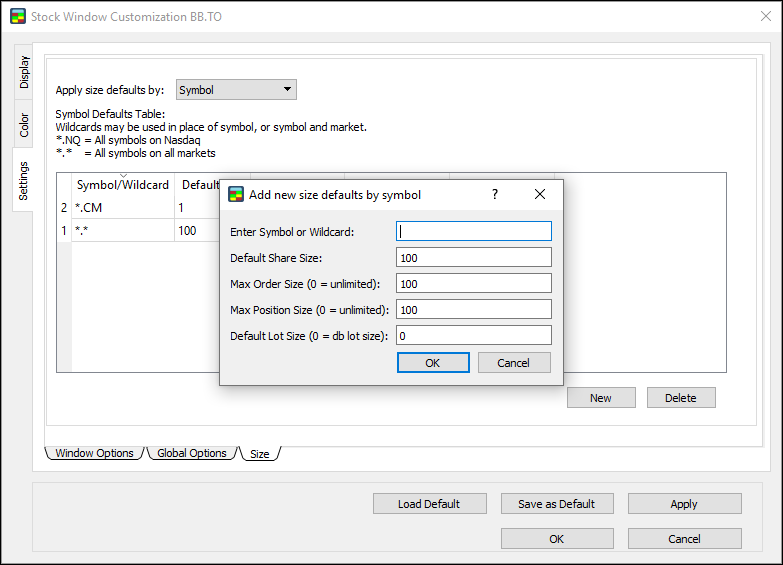
3. Type values into the following fields: Enter Symbol or Wildcard, Default Share Size, Max Order Size, Max Position Size, and Default Lot Size.
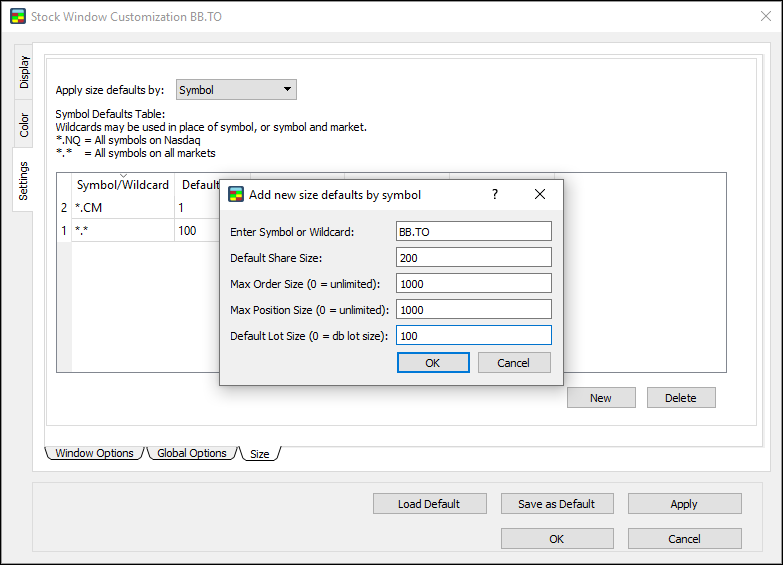
4. Click OK.
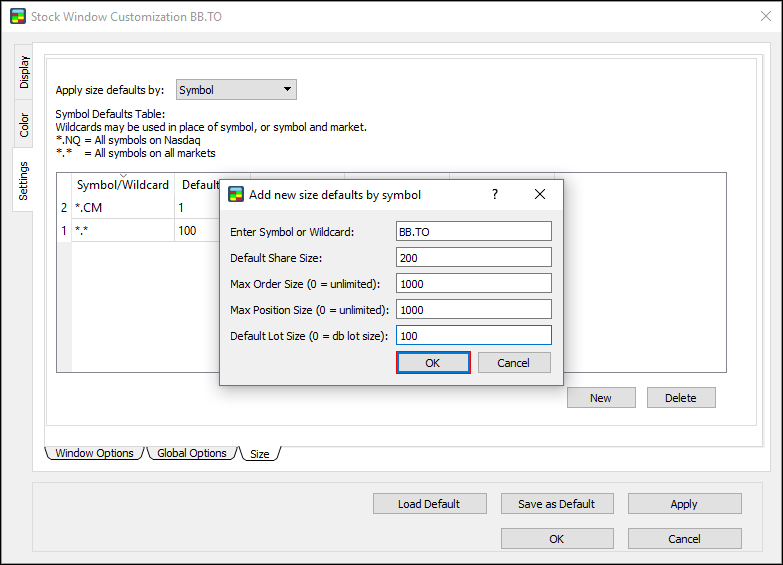
5. In the Size window, click OK.
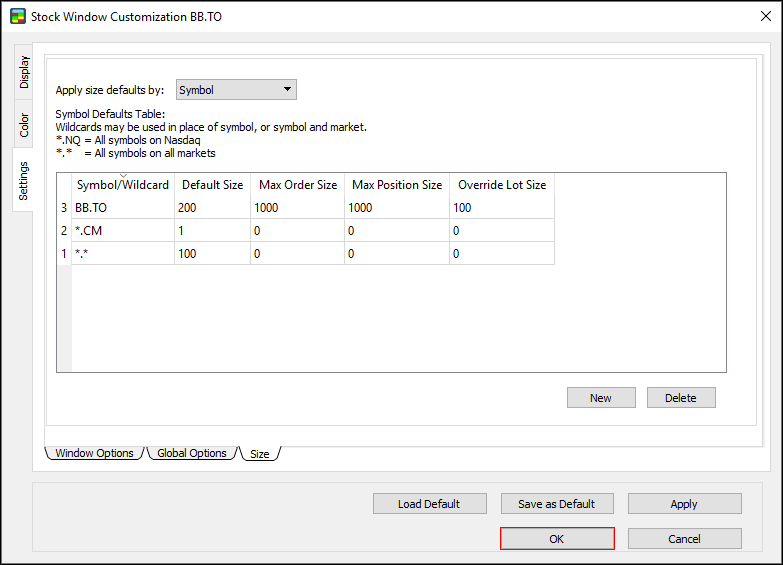
6. The size defaults are set for the symbol.
Set size defaults by window
1. Click Window.
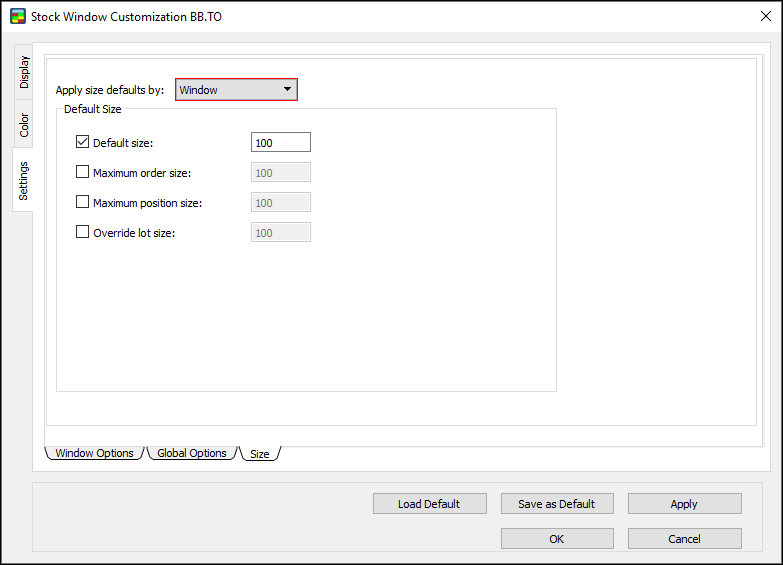
2. Select or clear the check boxes for Default shares, Maximum order size, Maximum position size, and Override lot size.
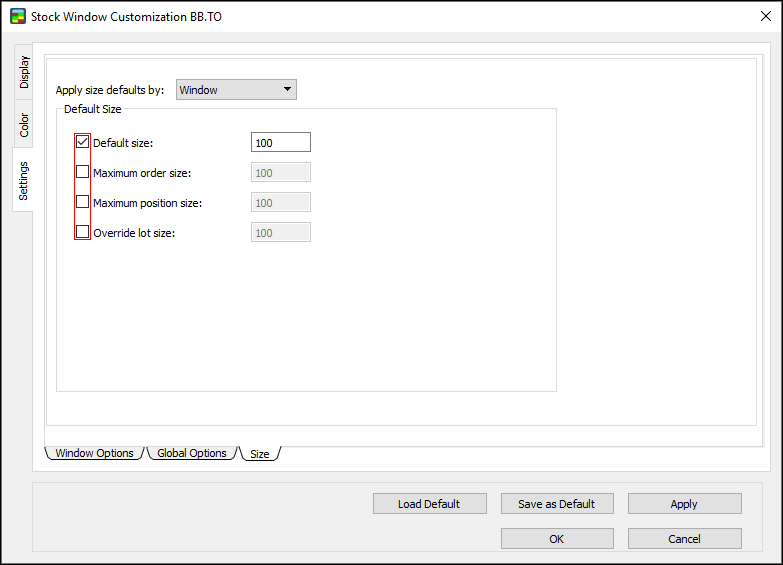
3. Type a numerical value for each selected option.
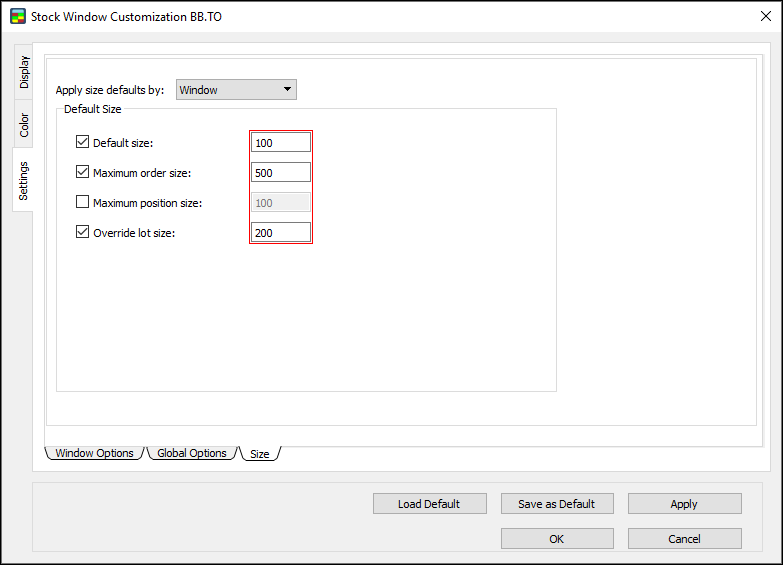
4. Click OK.
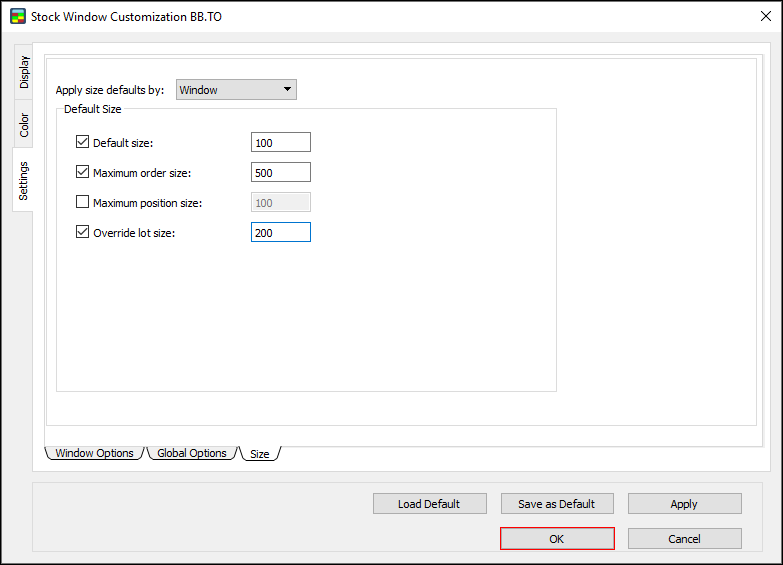
5. The size defaults are set for the window.
Set an override lot size
Use the override lot size feature to set the override lot size for a certain symbol or wildcard.
1. In the Size window, click the Override Lot Size cell for a symbol or wildcard.
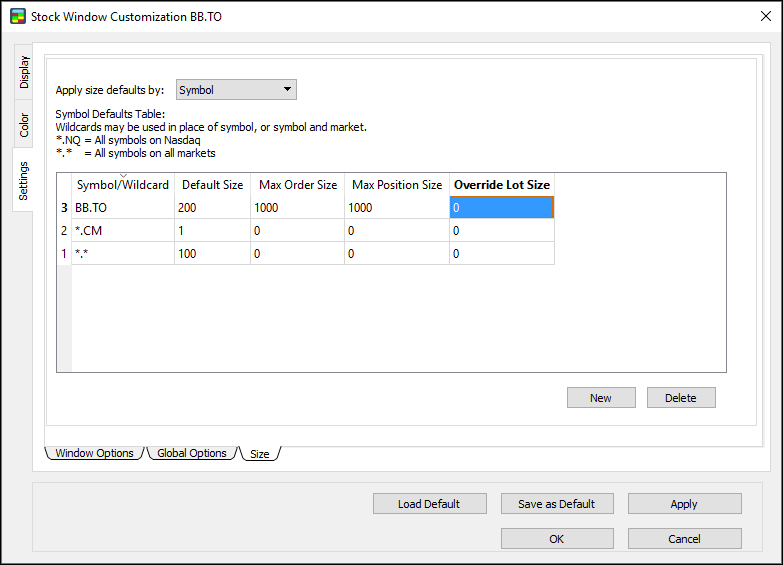
2. Type the override lot size you want to set for the symbol.
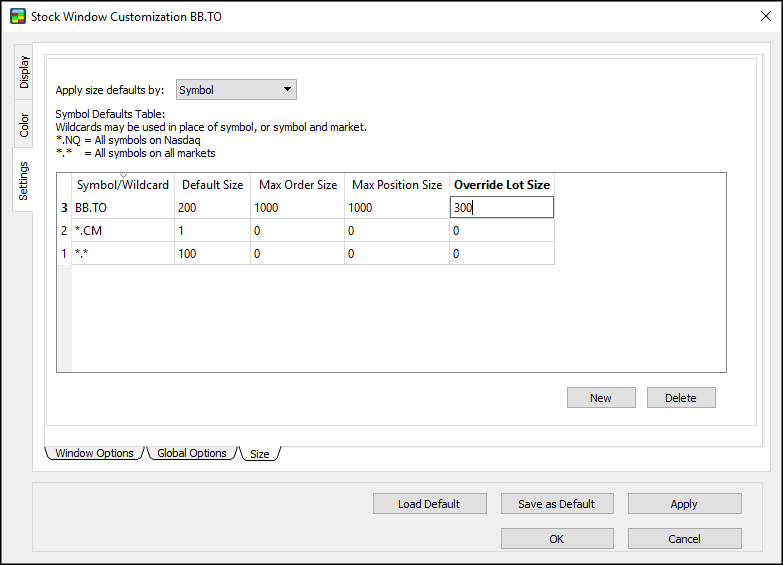
3. Press Enter, and then click OK.
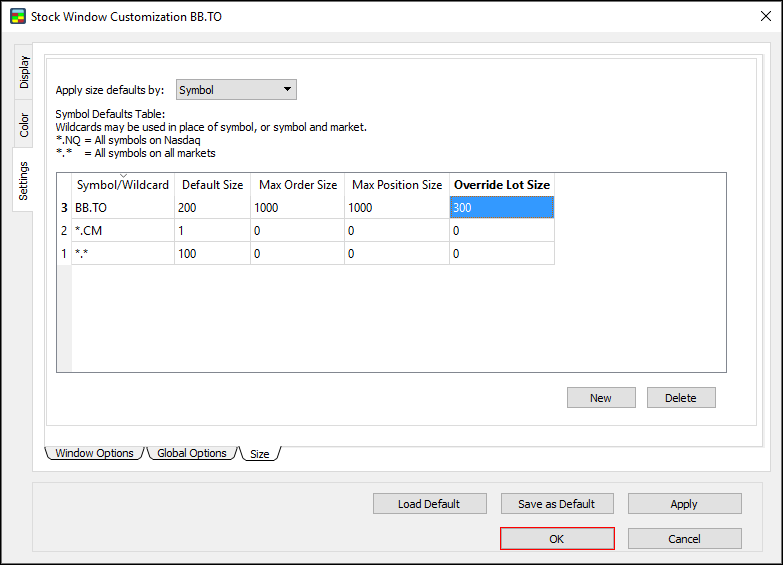
4. The override lot size is set.
Example: with an override lot size set to 300, press Ctrl + 1 in the Stock Window to override the lot size to 300, Ctrl + 2 to override to 600, Ctrl + 3 to override to 900, and so on.
Alignment Editor
Use the Alignment Editor to align columns to the left, center, or right in the Stock Window.
Align a column in the Stock Window
1. Right-click a column heading, such as MPID, Price, Size, Time, Depth, or Total, in the Stock Window.
2. The Alignment Editor appears.
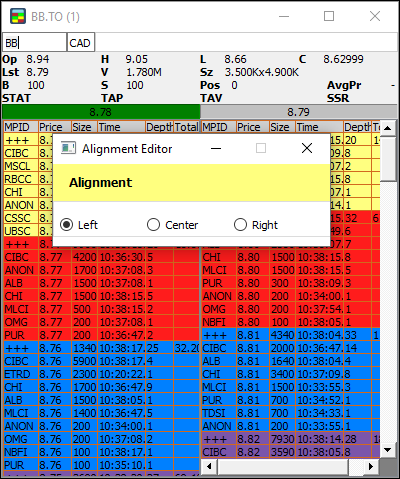
3. Click Left, Center, or Right to align the column left, center, or right.
4. The column is aligned.
>Back to Top
PPro8 Summary
The PPro8 Summary displays the summary of a trader’s activities for the day.
Open a Summary window
1. On the PPro8 toolbar, click Summary.

2. The Summary window appears.
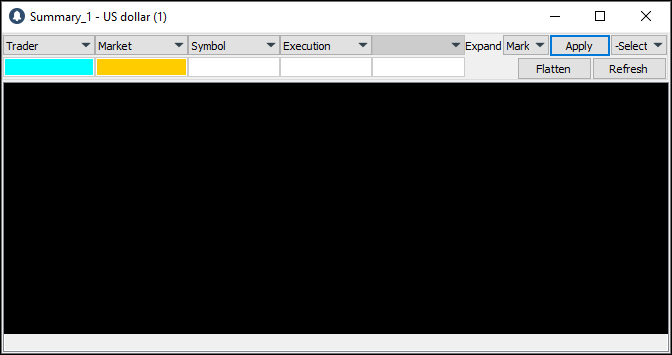
*Note: the Summary window is Always Open upon PPro8 login.
Summary Order Edit Box (SOEB)
Use the Summary Order Edit box to manage positions instead of just clicking Flatten. To use this function, follow these steps.
1. Open the Summary window.
2. Right-click a Position Layer, and then click New Order.
3. The Summary Order Edit Box appears.
4. Click or type order edit information as needed (gateway, side, shares, and other fields).
5. Click Execute.
6. The order is executed with the SOEB.
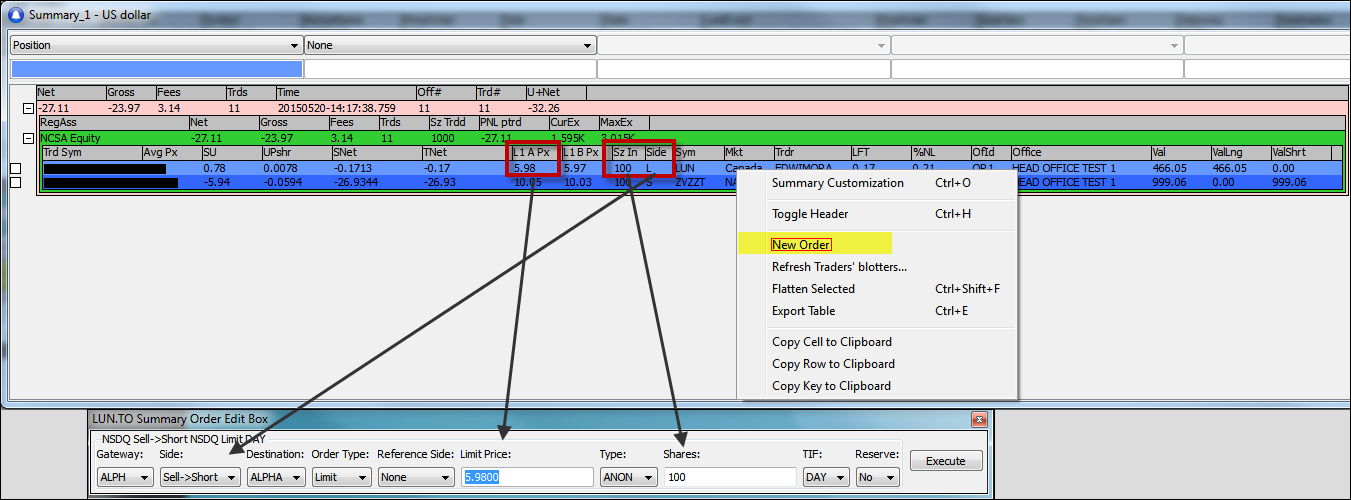
Learn about the Summary window
The Summary window automatically populates with information when an order is accepted. This information appears in Rows and Layers of different colors, which can be customized.
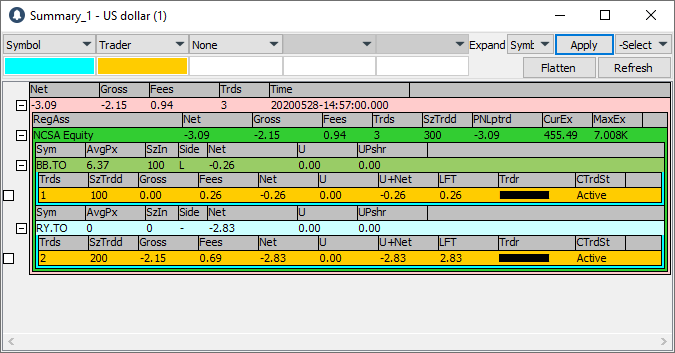
There can be many Rows for a single type. All of them show information summarized by the same characteristic of an execution. You can apply several row types on the Execution information on top of each other, to separate the summarized information by characteristics described on each Row.
There are ten row types in total: Global Total, RegionAsset, Trader, Symbol, Office, Market, Executions, Currency, and Position.
A Layer consists of these Rows added on top of each other. Each Layer shows the summary of information for the Rows on that layer, separated to show only information that matches the Row one Layer above.
When using Summary with several Layers of Rows, you can expand each Row to display further Rows showing information from one Layer below. Executions is always the last Layer on any summary view.
Note: the default currency in Summary: Execution is the local currency specific to the market of the symbol being tracked. For other layers, the default currency is USD.
Layer 1: Layer 2: Execution…
The first Layer aggregates the information for all Executions that match that Layer’s row type. The second Layer aggregates all the information for all Executions that match both the Layer one row above, and the characteristic of that Layer 2 row’s type.
For Trader: Symbols: Execution
The first Layer shows one row per trader. The second Layer shows all the symbols traded by that trader. The third Layer shows all the executions for a symbol by the trader. Each trader row shows the aggregated information for all executions that match a particular trader. Each of the Symbol rows shows the aggregated information for all executions that match both the Trader ID (from the previous Layer) and the symbol from the current row’s Layer.
Expanding and collapsing rows
To display information for several row Layers, expand or collapse a row that has Layers below. When you load the summary it displays only the rows for the top Layer by default. You can then expand the summary view. For individual rows, you can use the Expand/Collapse function. This appears in the form of a plus sign next to each row. Click on the plus sign to expand the row, and on the minus sign to collapse it.
- When a row is collapsed, Summary displays an icon that looks like a square with a plus sign inside it:

- When a row is expanded, Summary displays an icon that looks like a square with a minus sign inside it:

Buttons
Apply: after selecting a set of layers to use for Summary, click Apply to display changes. When you click Apply, the button becomes unavailable. If one of the layer boxes or the Expand menu changes, the button becomes available again.
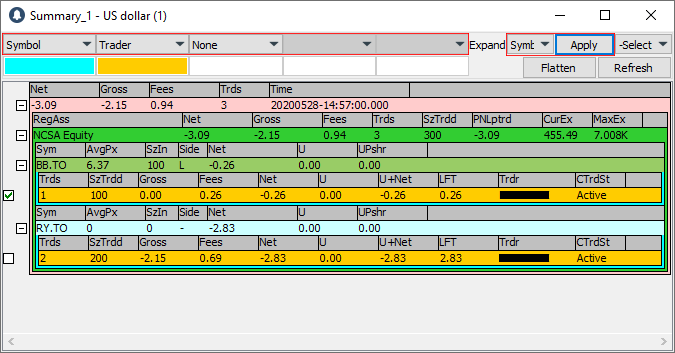
Cancel: select the check box next to a row, and then click Cancel to change your filter selections back to the previously applied filter selection.
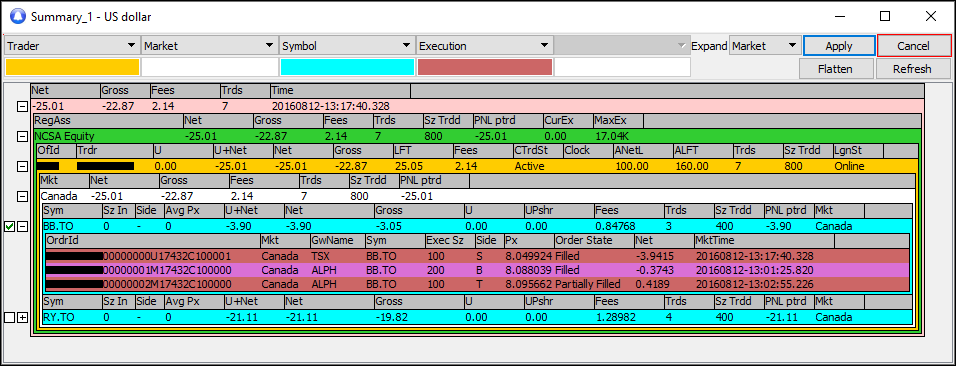
Flatten: select the check box next to a row, and then click Flatten to flatten it. A Flatten request will cancel all open orders for the symbol. It will also cancel all scripts on the symbol, provided that the trader has a position or an open order on the symbol.
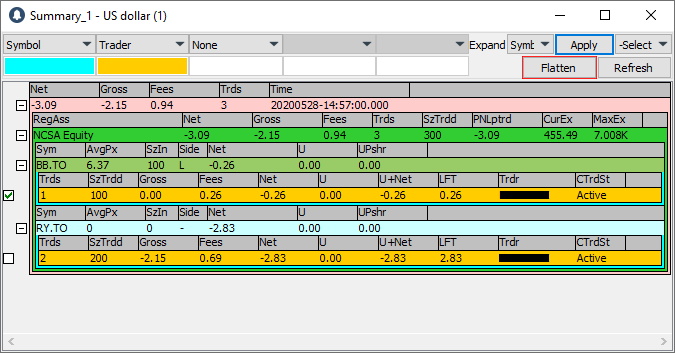
You can also flatten selected positions by right-clicking on the row, and then clicking Flatten Selected; or by using the keyboard shortcut Ctrl + Shift + F.
Note: to prevent large errors, you can automatically flatten only these row types: Symbols, Office, and Trader.
Refresh: use Refresh to request all execution reports for a subset of traders. This is helpful if you lose connectivity or if you believe the data are incorrect. Click Refresh to open the Summary Refresh window.
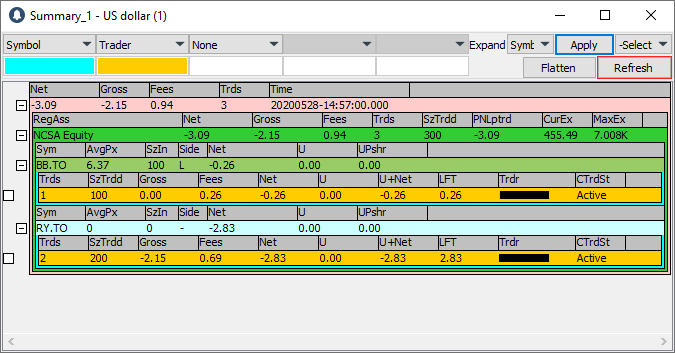
This window has three panes: Region / AssetClass, Office, and Trader ID.
- Region / AssetClass shows all available regions and asset classes.
- Office shows all offices for which you have rights.
- Trader ID shows all trader IDs in the offices selected in the Office pane.
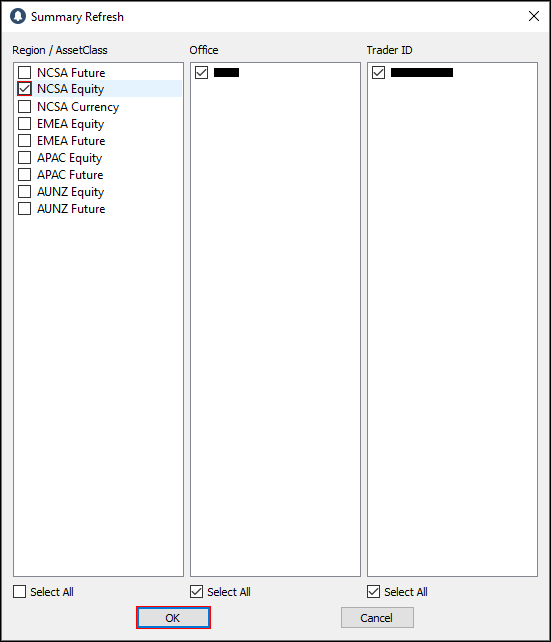
Select a check box for a region/asset class and click OK to refresh. You can also refresh by right-clicking on a row, and then clicking Refresh Traders’ blotters; or by using the keyboard shortcut Ctrl + R.
Toggle Header: toggle the display of the Header by right-clicking a row, and then clicking Toggle Header; or by using the keyboard shortcut Ctrl + H.
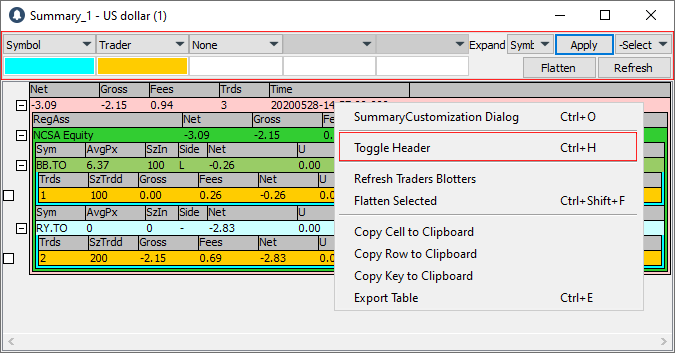
Summary Customization
To make changes to the Summary settings, right-click anywhere in Summary, and then click Summary Customization to open the Summary Customization window. You can also open it by using the keyboard shortcut Ctrl + C.
This window displays three main tabs on the left: Display, Scope, and Filters.
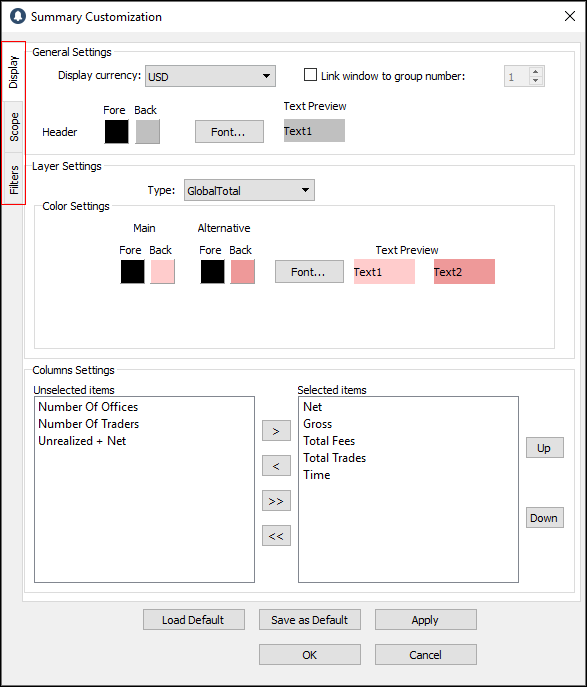
Display
Use the Display window to set the display settings for Summary.
- Click the Display tab to open the Display window.
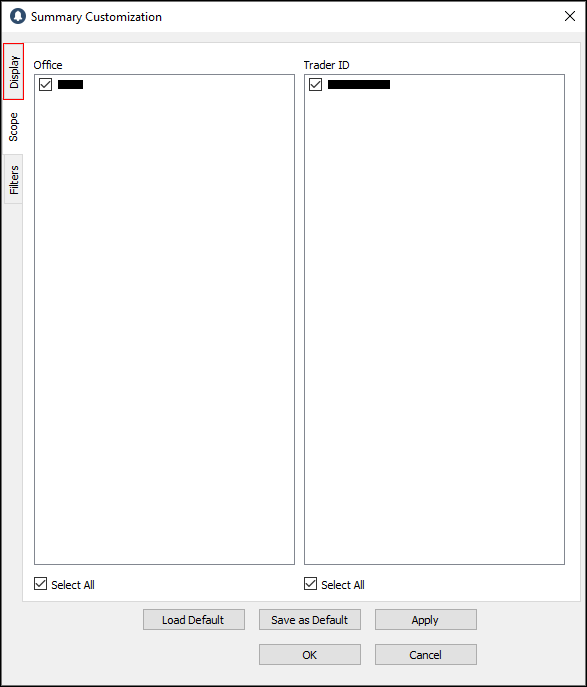
The Display window contains three components: General Settings, Layer Settings, and Columns Settings.
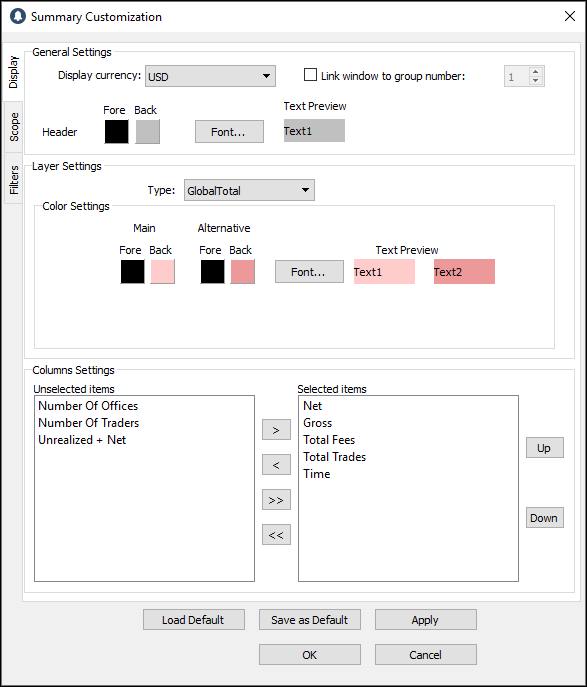
A. General Settings
Change display currency
1. Click the currency you want to set.
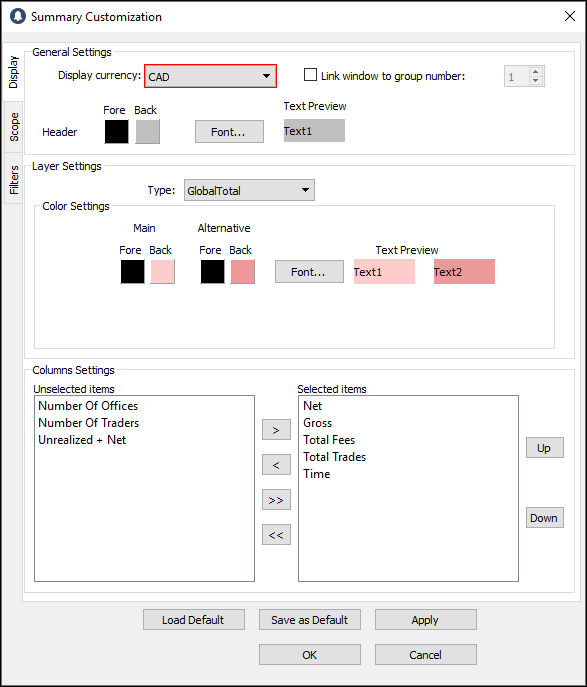
2. Click OK.
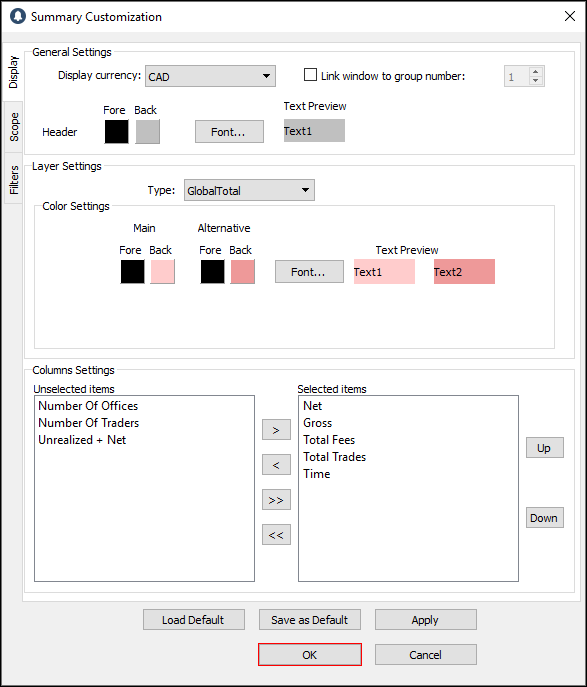
3. The new display currency appears.
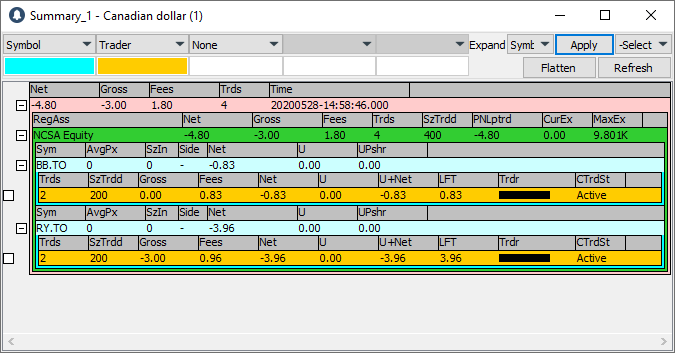
Set a color for the Header
1. Double-click the color box next to a feature, for example, Fore (foreground).
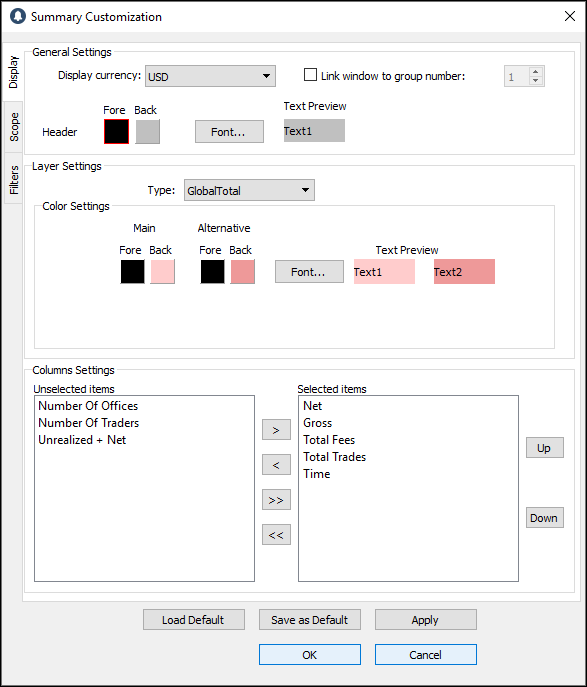
2. The Color dialog window appears. Click a color, and then click OK.
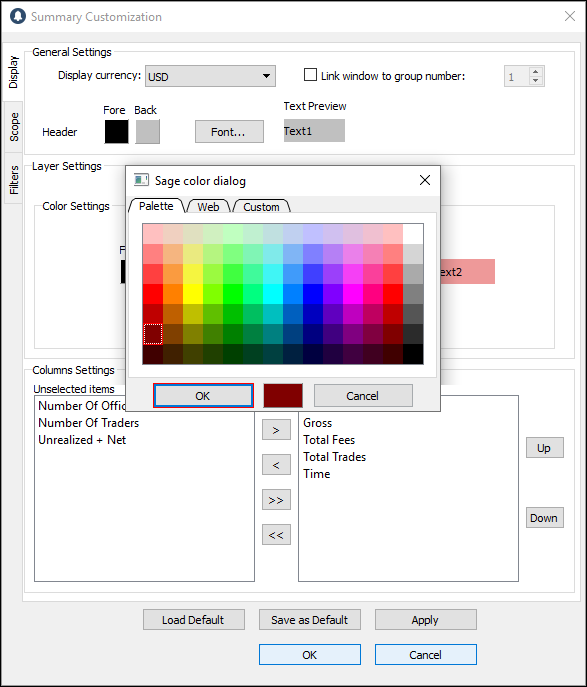
3. In the Summary Customization window, click OK.
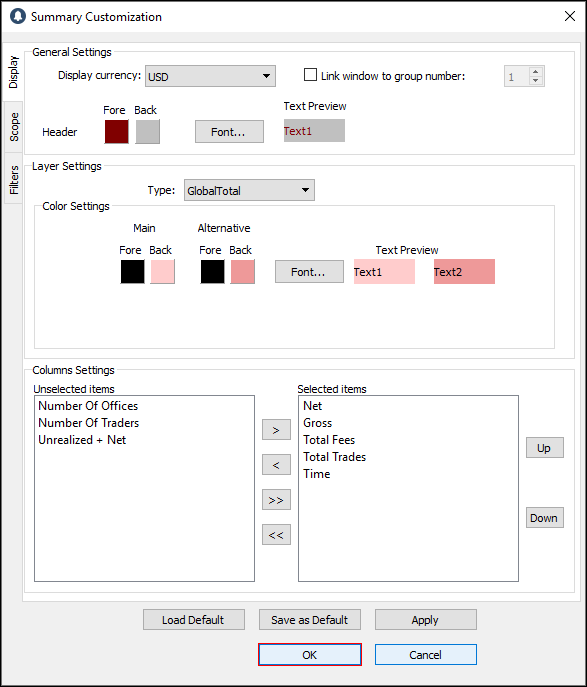
4. The color is set.
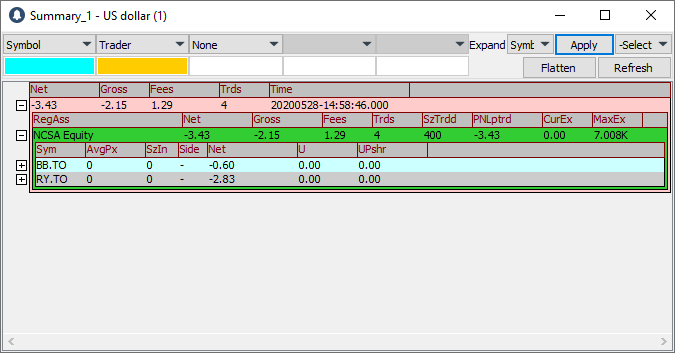
Set a font for the Header
1. Click Font….
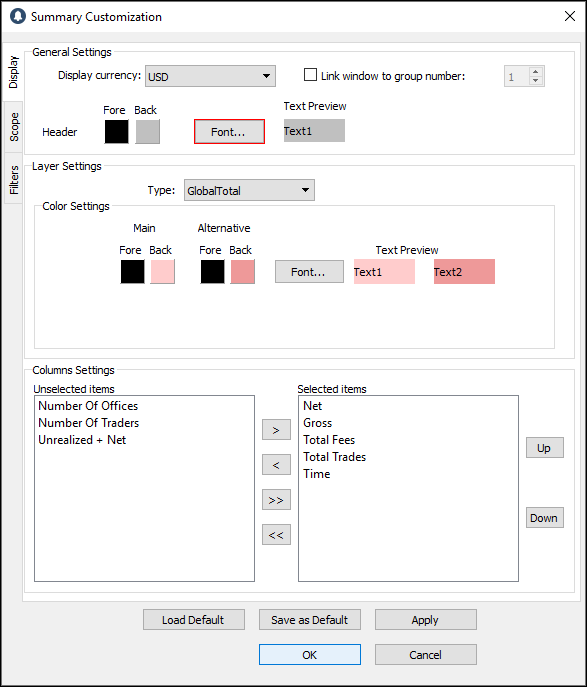
2. The Select Font window appears.
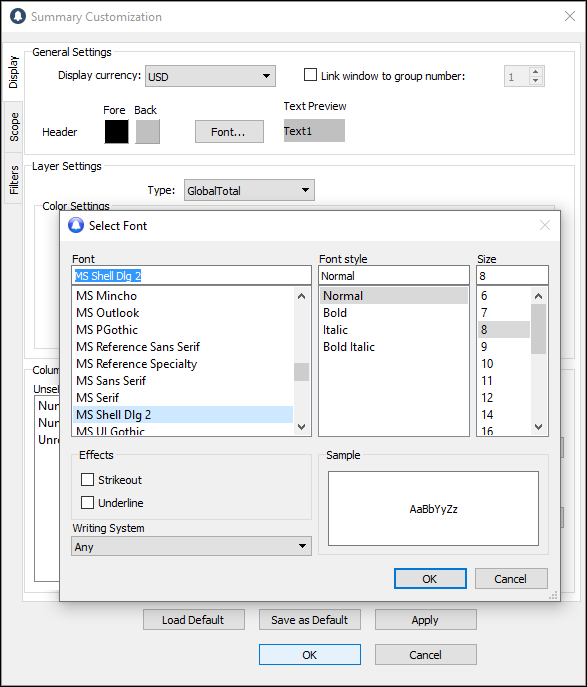
3. Click the font, font style, size, effects, and writing system you want to set.
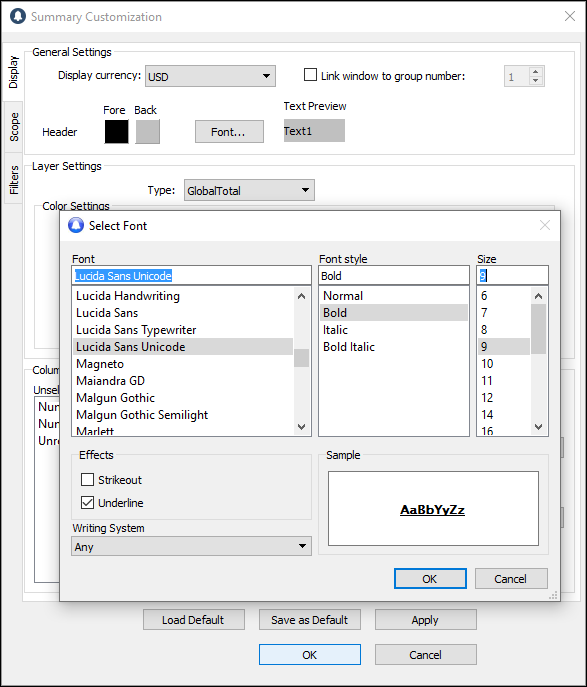
4. Click OK.
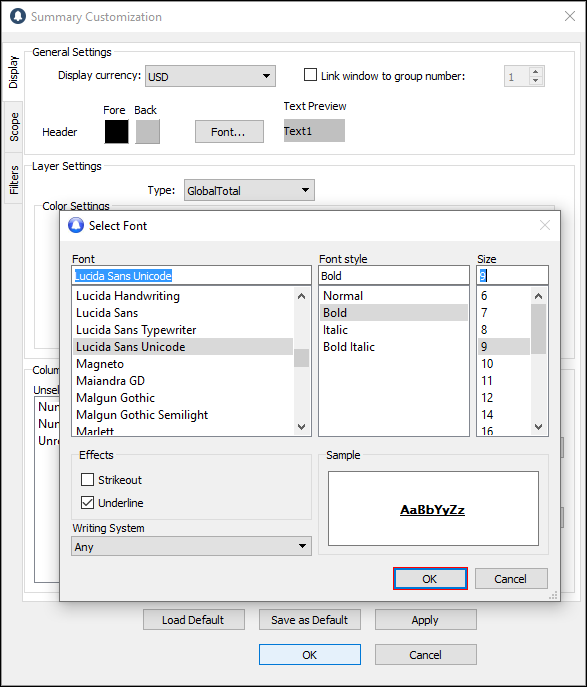
5. Next, click OK.
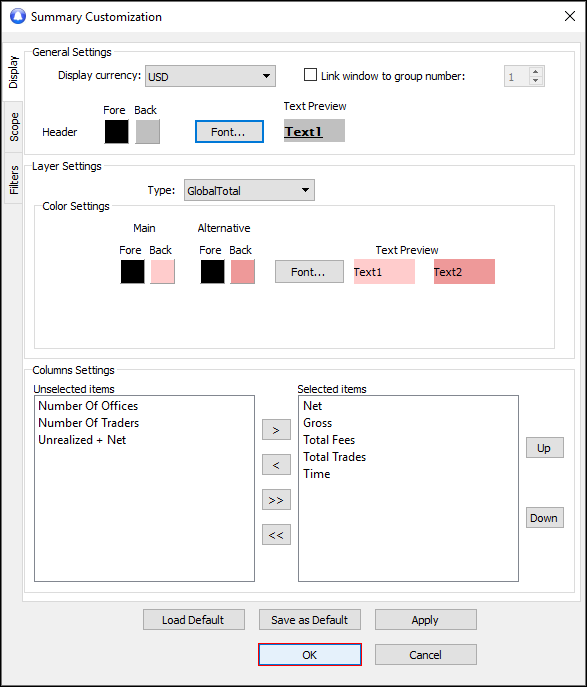
6. The new font appears in the Summary window.
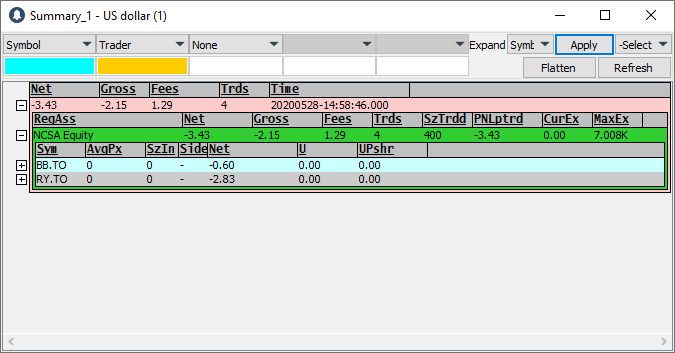
B. Layer Settings
Set a color for a layer setting type
1. Click a layer setting type, for example, Market.
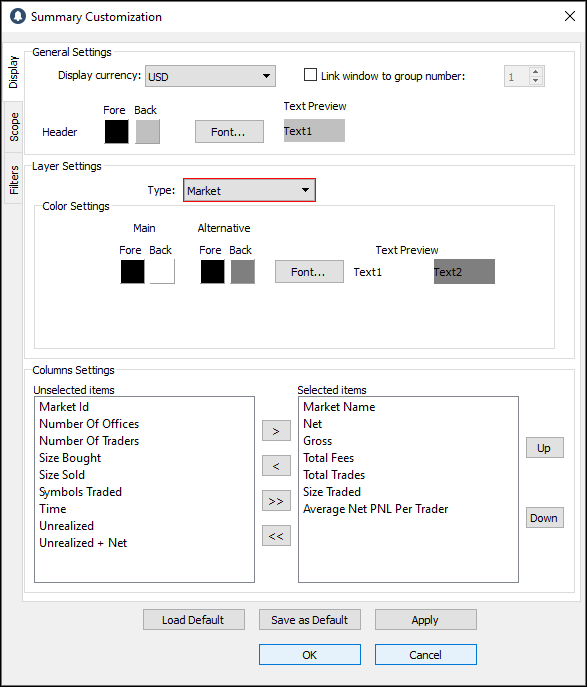
2. Double-click the color box next to a feature, for example, Back (background) under Main.
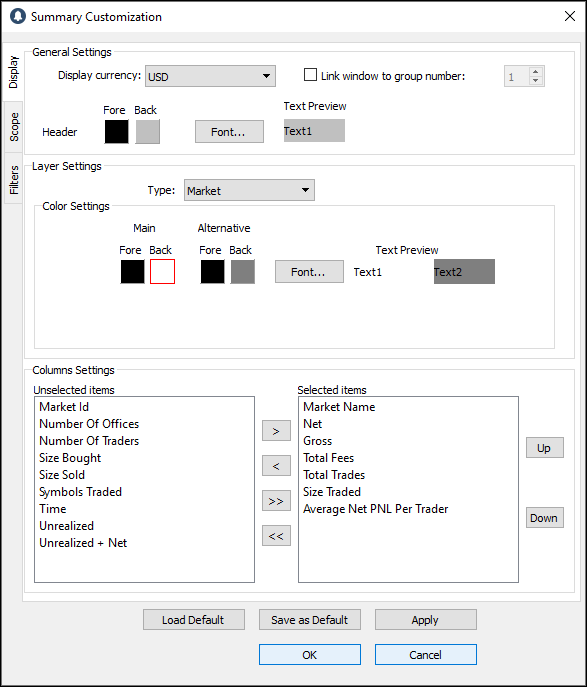
3. The Color dialog window appears. Click a color and then click OK.
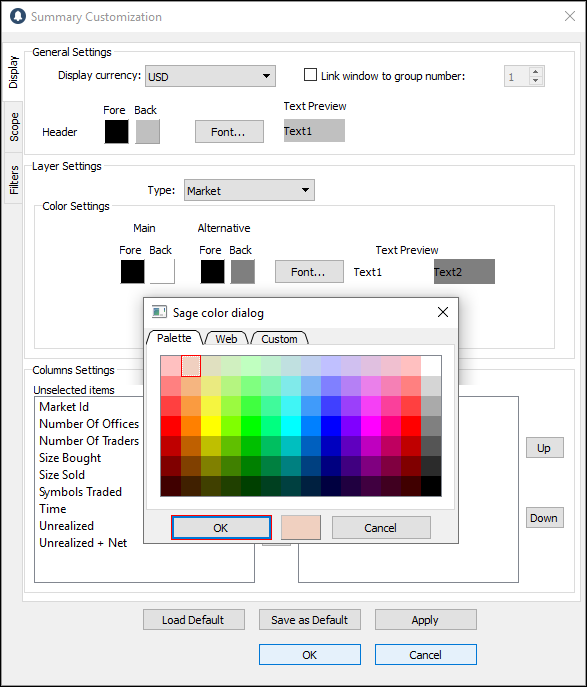
4. Next, click OK.
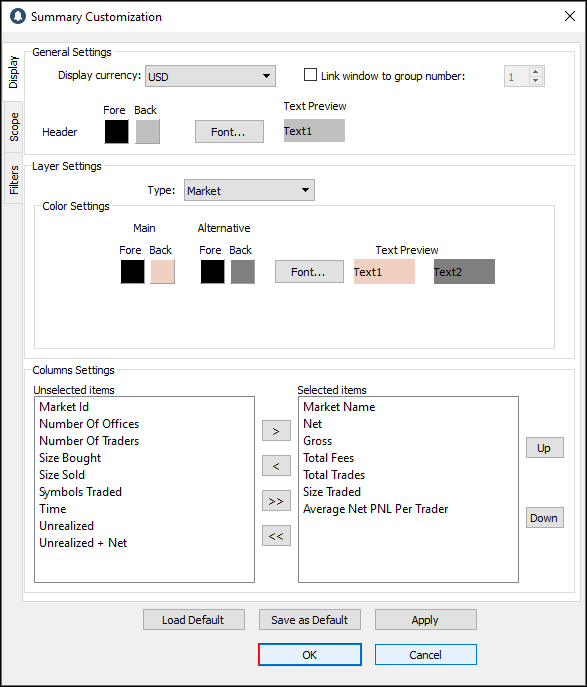
5. The color is set.

C. Columns Settings
Show a column in Summary
1. Click an item in the Unselected items list.
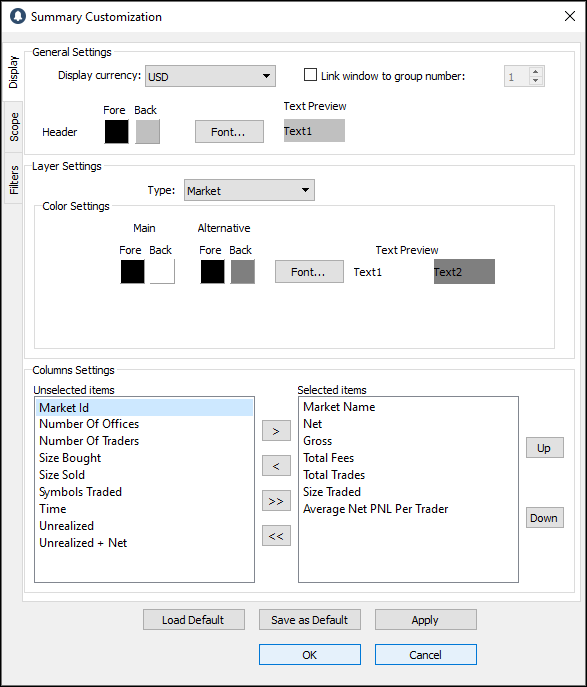
2. Click the right arrow to move the item to the Selected items list.
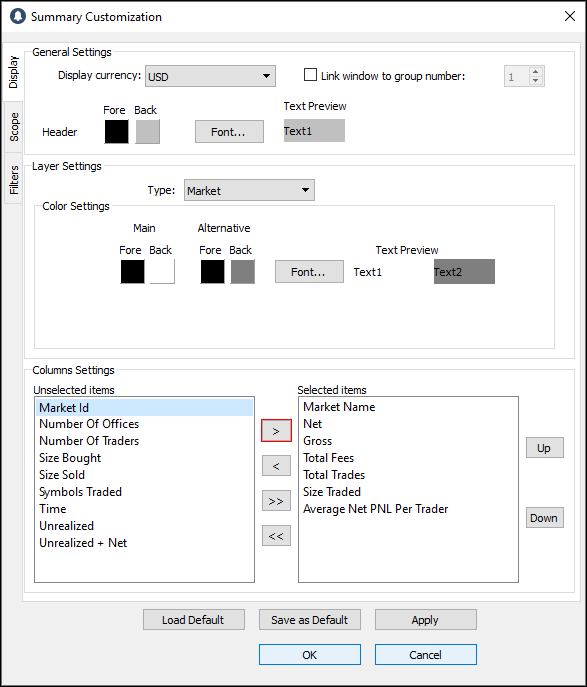
3. Click OK.
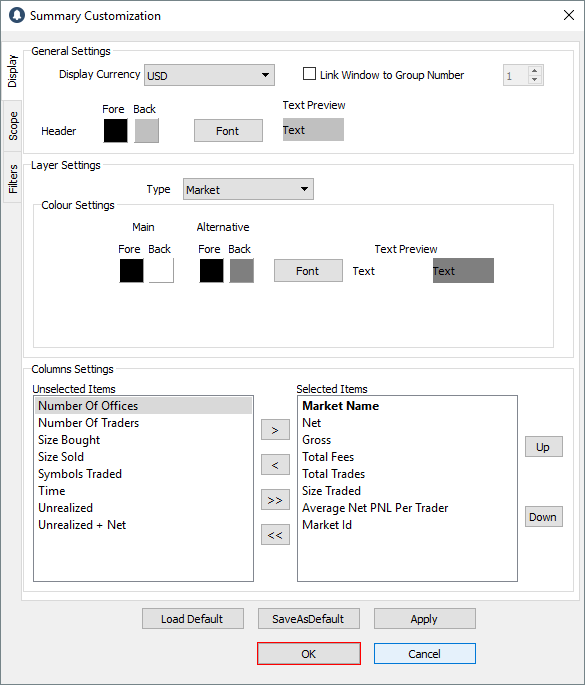
4. The column appears in the Summary window.
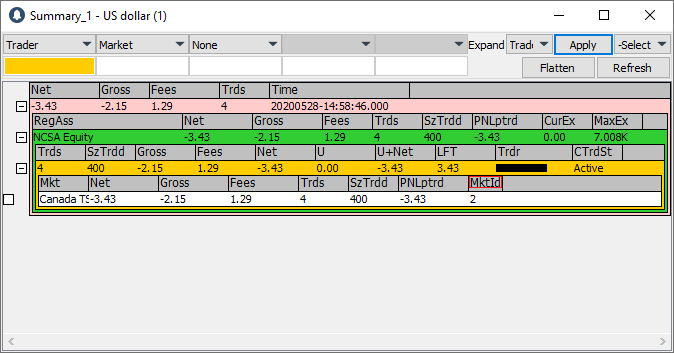
Hide a column in Summary
1. Click an item in the Selected items list.
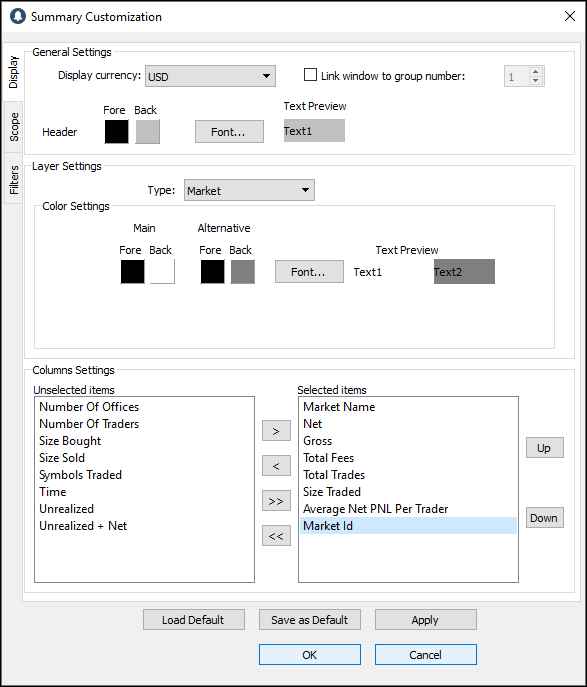
2. Click the left arrow to move the item to the Unselected items list.
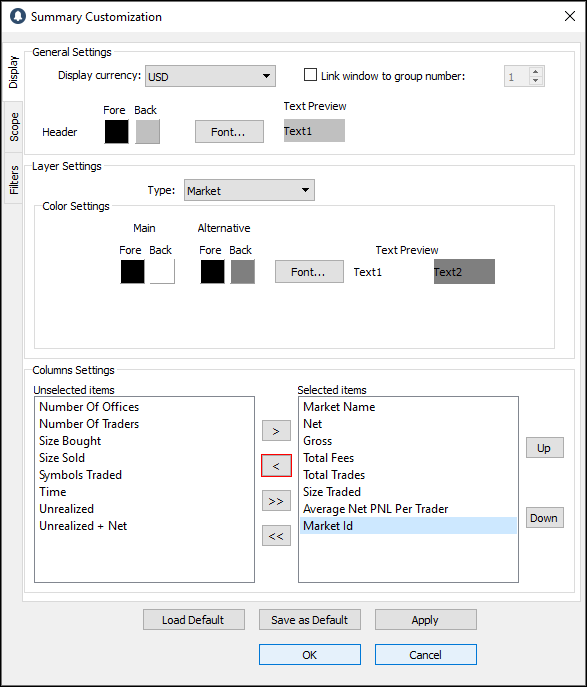
3. Click OK.
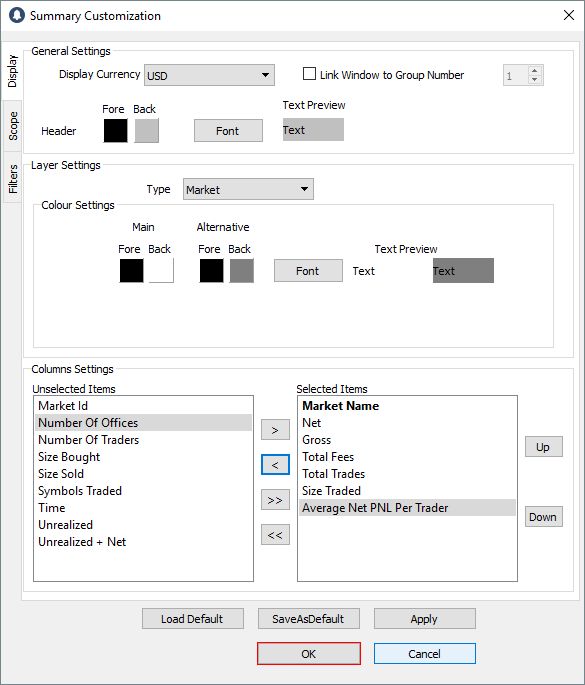
4. The column is hidden from the Summary window.

Scope
Managers or Operations staff who have the necessary permissions can use the Scope window to limit the offices and trader IDs that appear in Summary and focus on a particular subset of traders in a certain office.
- Click the Scope tab to open the Scope window.
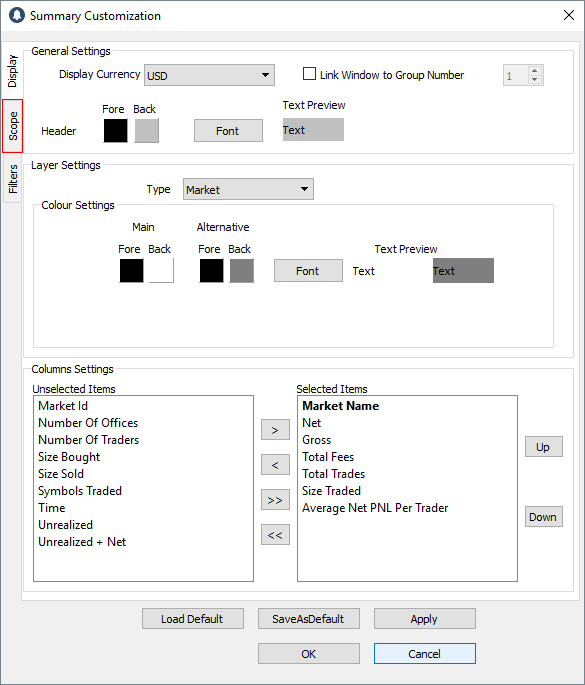
The Scope window contains two panes: Office and Trader ID.
The Office pane shows the offices that a user has permission to see, and the Trader ID pane shows all the traders in the selected office.
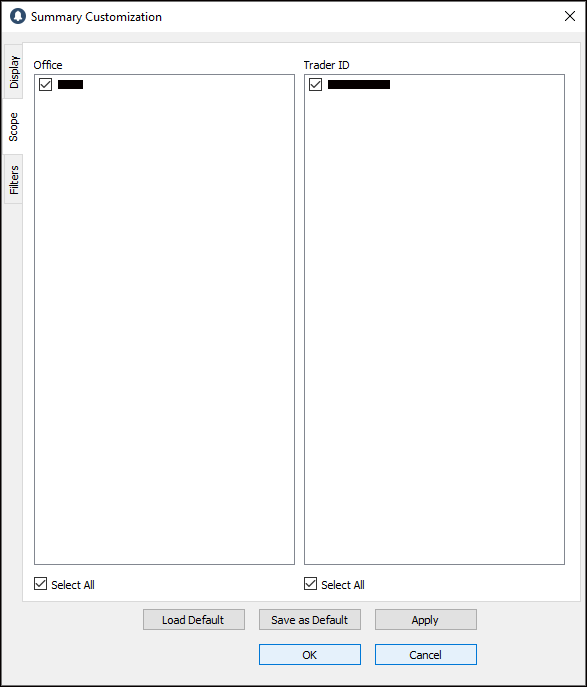
When a change is made to scope, Summary rebuilds using only the OSTATS (order statuses) that match the selected office and trader IDs.
By default, all Offices and all Trader IDs appear as selected in the Scope window.
Filters
Use the Filters window to set filters based on the various row types.
- Click the Filters tab to open the Filters window.
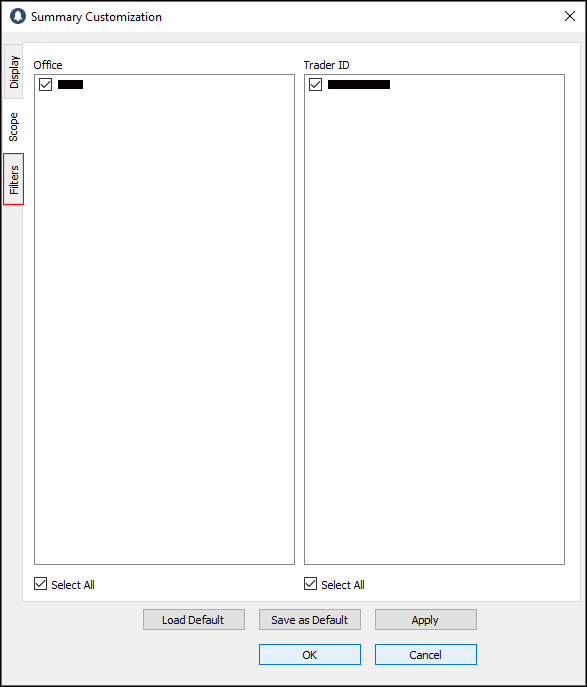
Items in this section vary depending on the Row Type selected.
1. If Row Type = Trader
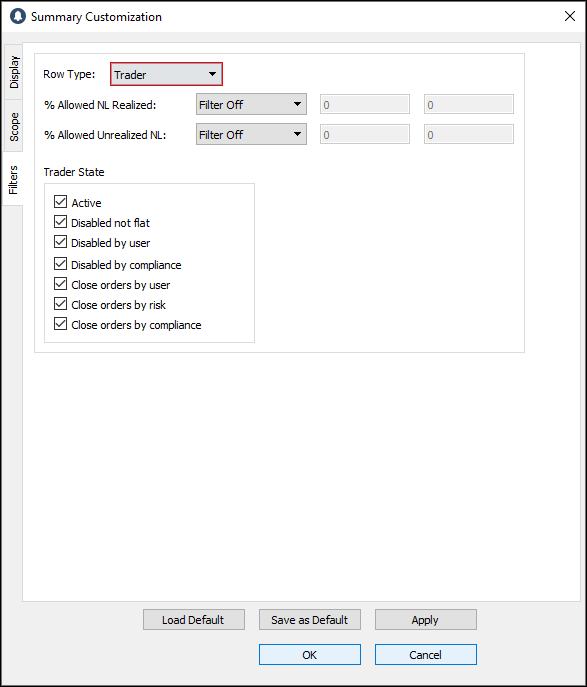
% Allowed NL Realized: if the filter is off, all % of allowed Net Loss realized appears. If the filter is on, the % set by such conditions appears.
% Allowed Unrealized NL: if the filter is off, all % of allowed Net Loss unrealized appears. If the filter is on, the % set by such conditions appears.
Trader State
- Active: the trader is active and able to trade.
- Disabled not flat: the trader is disabled. They cannot place any more orders but have an open position.
- Disabled by user: the trader is disabled by either the trader or by their manager.
- Disabled by compliance: the trader is disabled by the Compliance Team due to an illegal trade or other issue.
- Close orders by user: the trader has reached the maximum allowed NL or LFT, or has sent an illegal trade, and has a set amount of time left to flatten the position.
- Close orders by risk: the Risk Team set the trader as “Close Orders by Risk Issue.” The trader can flatten their positions before time runs out.
- Close orders by compliance: the Compliance Team set the trader as “Close Orders by Compliance Issue.” The trader can flatten their positions.
2. If Row Type = Symbol
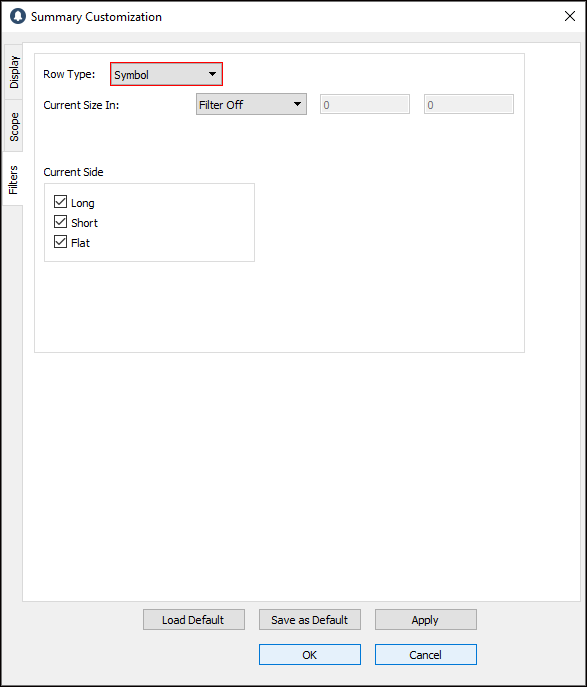
Current Size In: the number of shares the trader trades.
Current Side: when the appropriate check boxes are selected, Summary shows values for Long, Short, and Flat positions.
Export summary data
1. Right-click anywhere in the Summary window, and then click Export Table. Or, use the keyboard shortcut Ctrl + E.
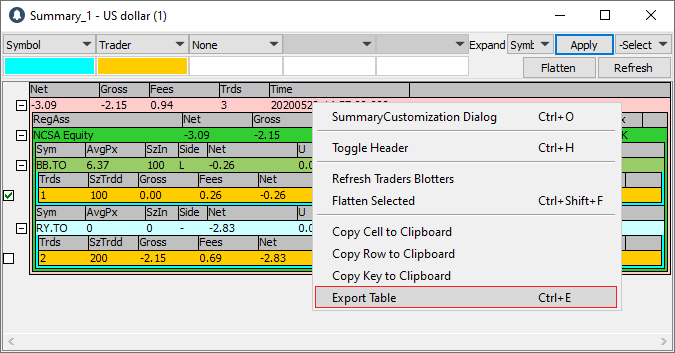
2. The Select Directory window appears.
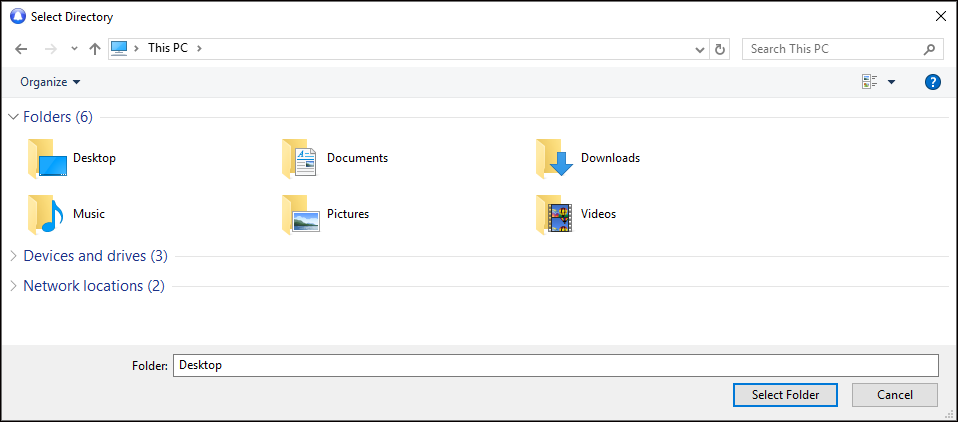
3. Find and click the folder where you want to save summary data.
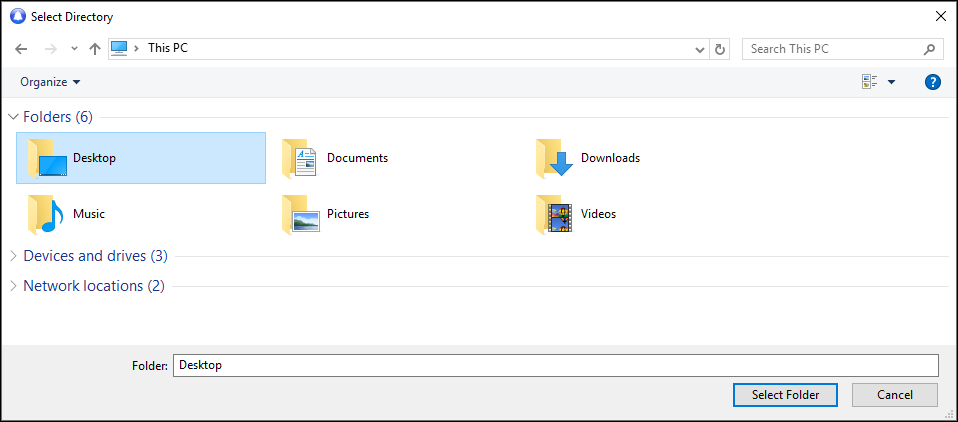
4. Click Select Folder.
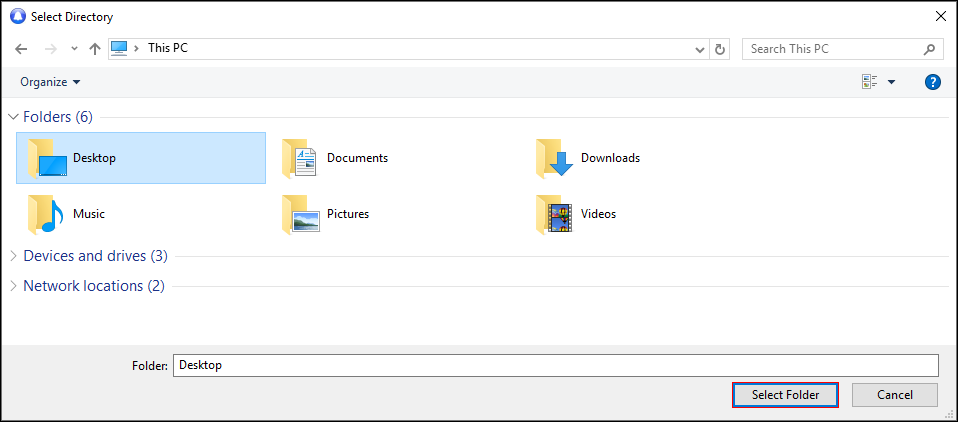
5. The data is exported to CSV files.
*Note: the export process generates one CSV file per summary layer. Each CSV file contains all the columns appearing in a layer, as well as a column for each layer above. The data in these files reflect the current view in Summary. File names are set as follows: “Summary” + layer name + current date, for example, “SummaryGlobalTotal2015-01-13_10-40-34”. Lower-level files include the preceding levels in the file name.
Copy summary data
1. Right-click a cell or row.
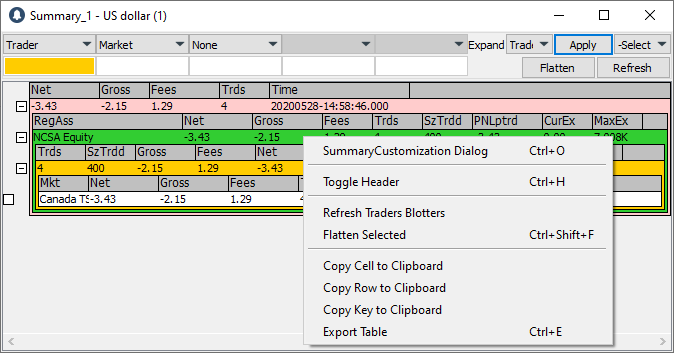
2. Click Copy Cell to Clipboard, or Copy Row to Clipboard, or Copy Key to Clipboard, as needed.
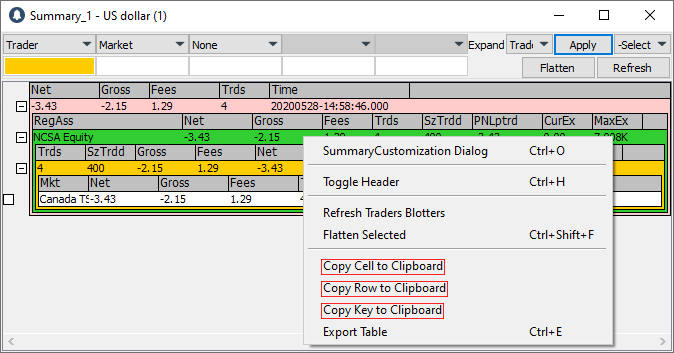
3. The cell, row, or key is copied to the clipboard. You can now copy and paste it where you choose.
>Back to Top
PPro8 Symbols List Editor
With the PPro8 Symbols List Editor, you can create and manage lists and sets of symbols. These lists can then be used in conjunction with other tools, such as Basket Order, Quote Board, and Ticker.
Open the Symbols List Editor
1. On the PPro8 toolbar, click SymbolsListEditor.

2. The Symbols List Editor window appears.
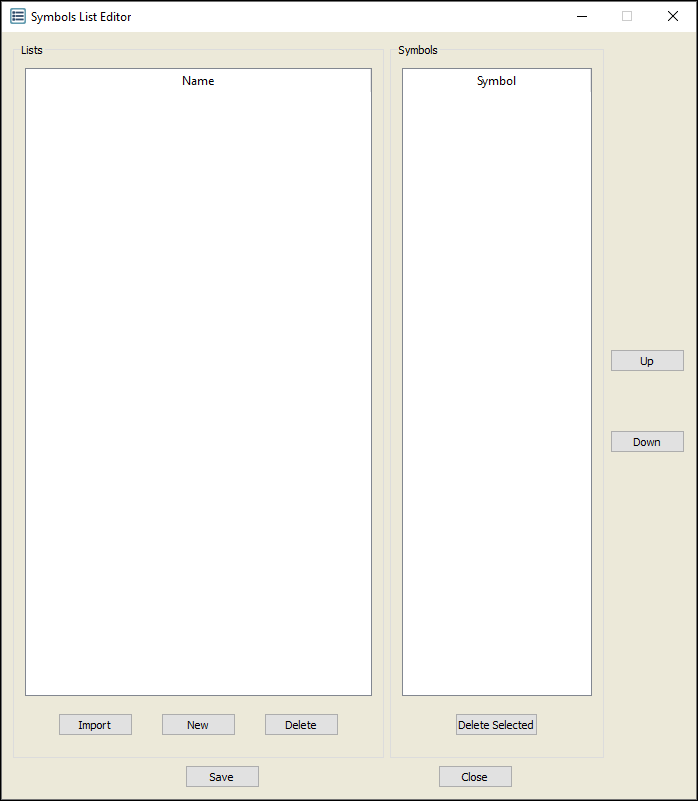
Symbols List Editor components
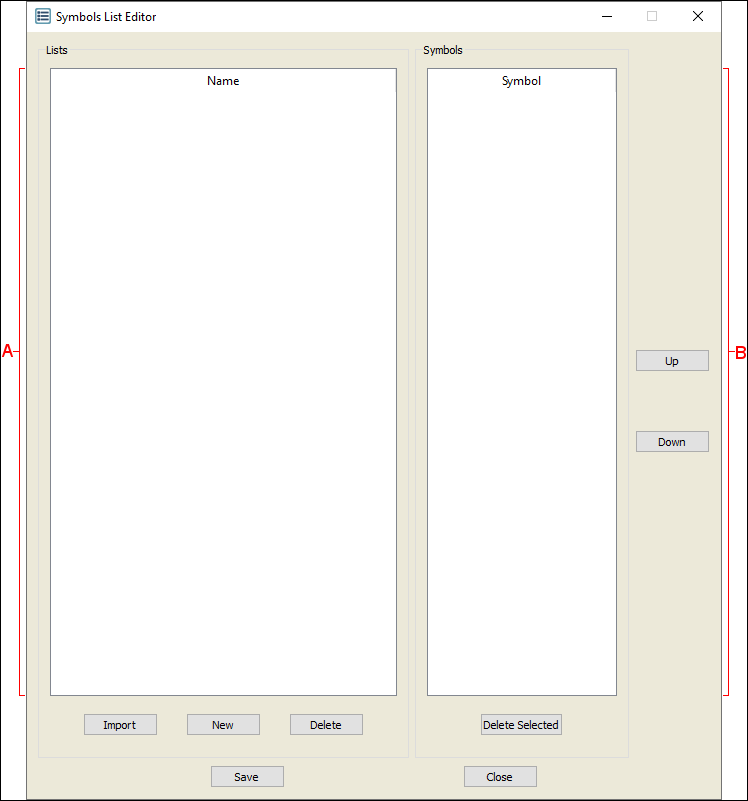
The Symbols List Editor contains two panes:
A. The Lists pane on the left contains a listing of pre-defined symbol lists.
B. The Symbols pane on the right contains a listing of the symbols in the currently selected symbol list.
Create a new symbol list
1. Click New.
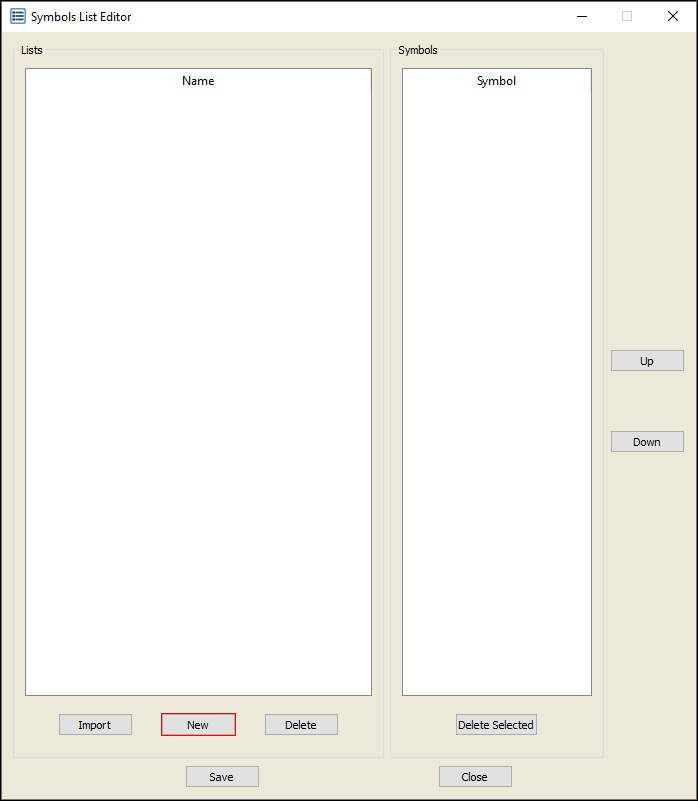
2. The Enter Symbol List Name window appears.
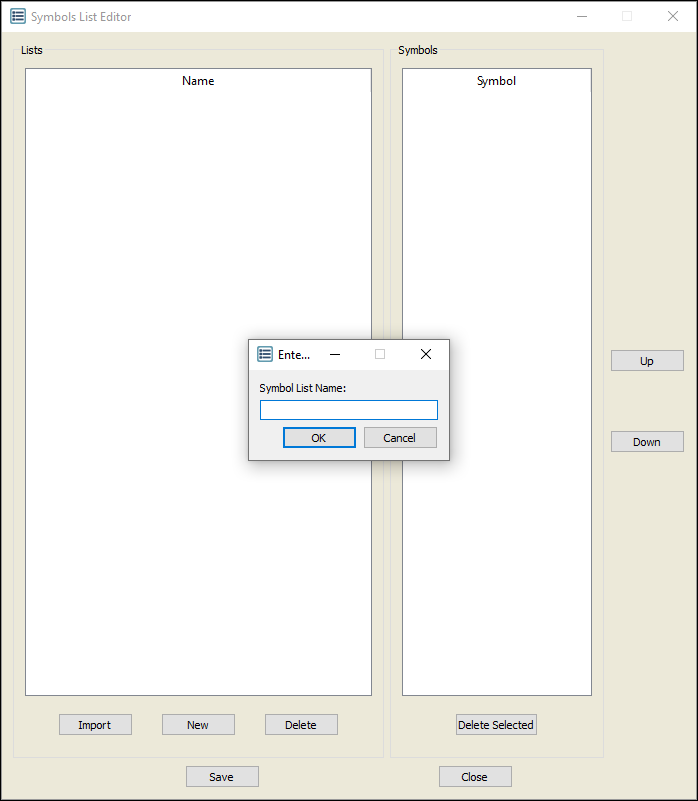
3. Type a name for the list, and then click OK.
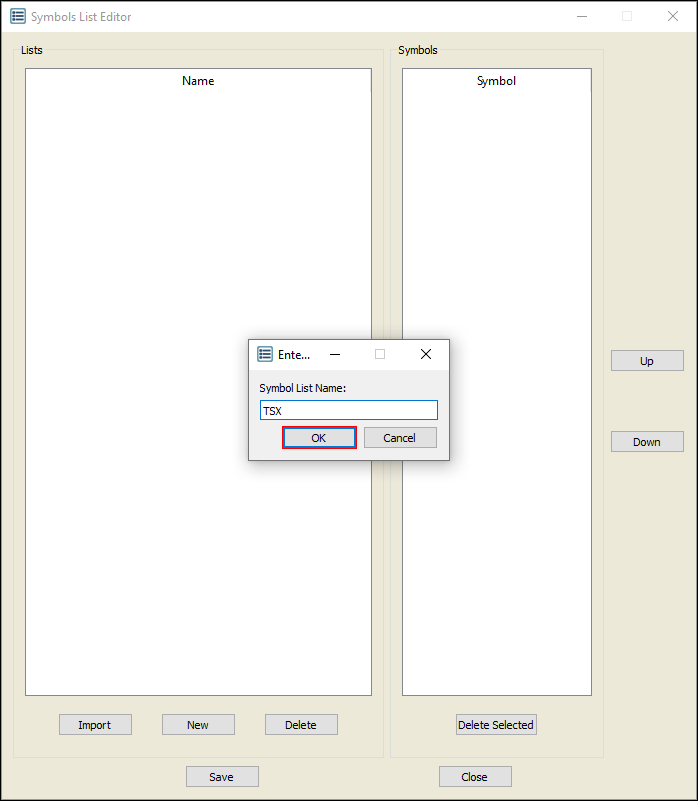
4. The list name appears in the Lists pane.
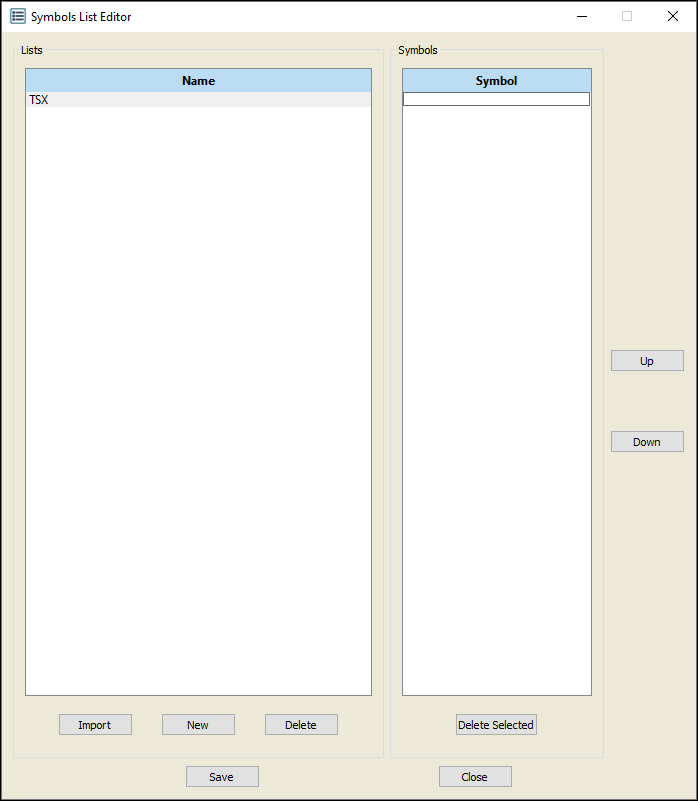
5. Type a symbol in the Symbols pane, and then press Enter. Repeat for additional symbols.
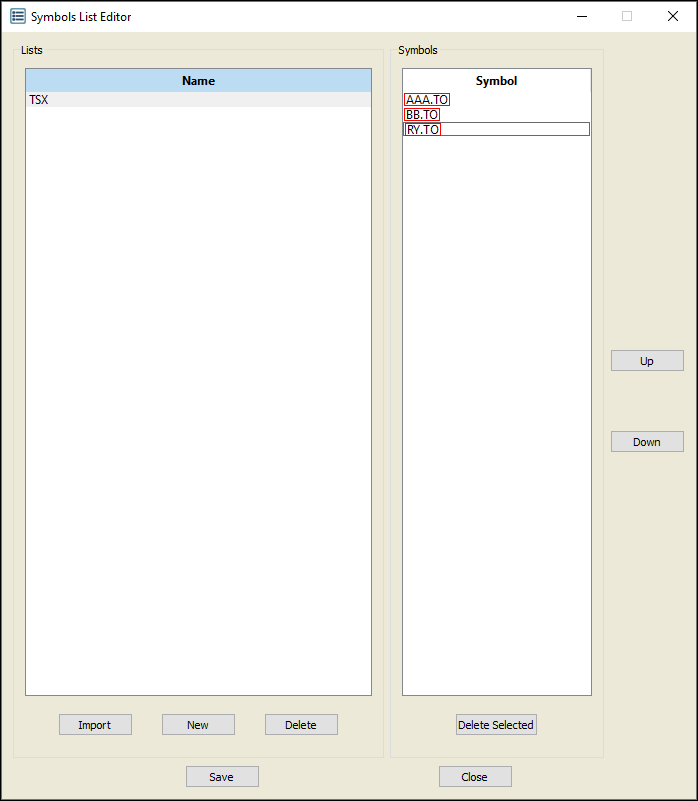
6. The symbols appear in the Symbols pane.
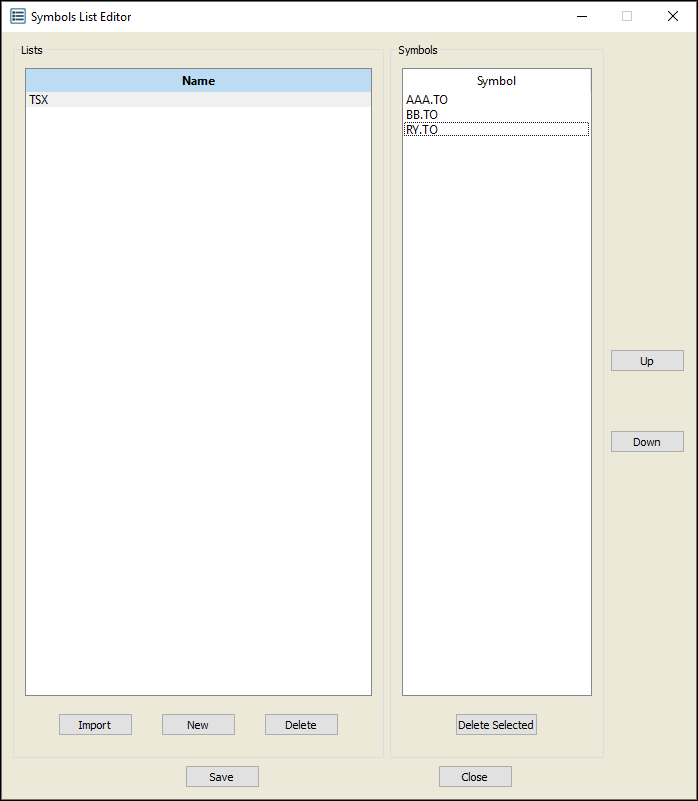
7. Create new lists with new symbols as needed. Note that a single list can contain symbols from multiple markets.
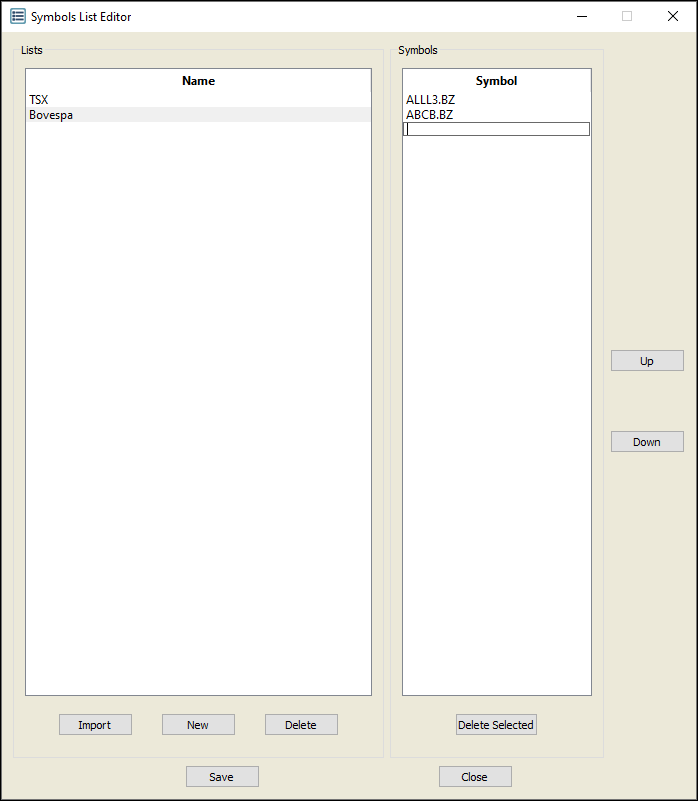
8. Click Save.
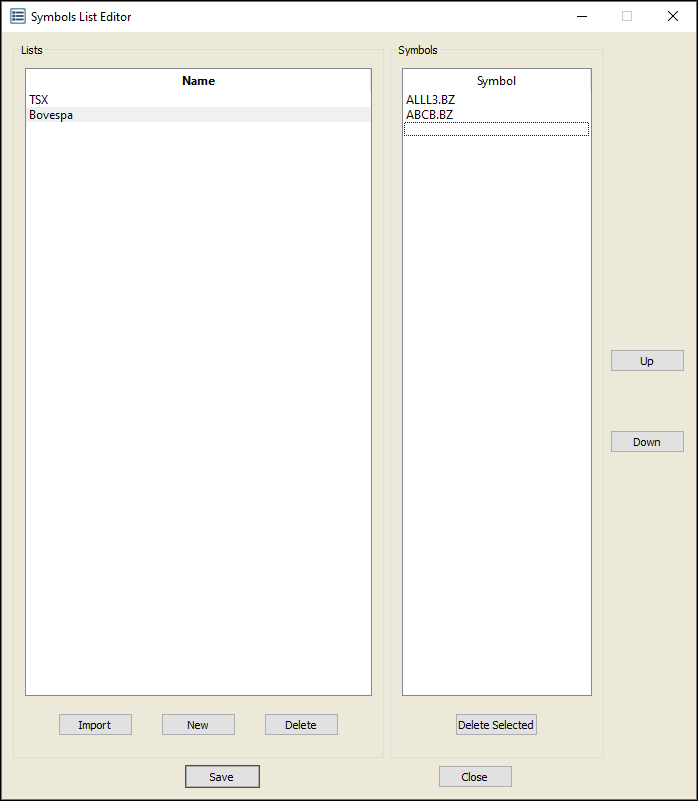
9. The Save Dialog window appears. Click Yes.
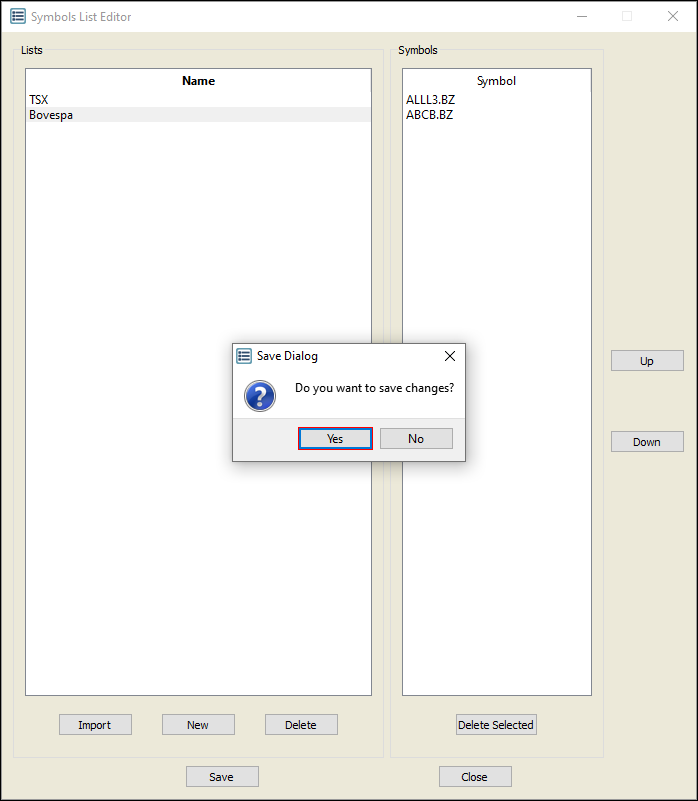
Edit a symbol list
1. Double-click the name of the symbol list you wish to edit.
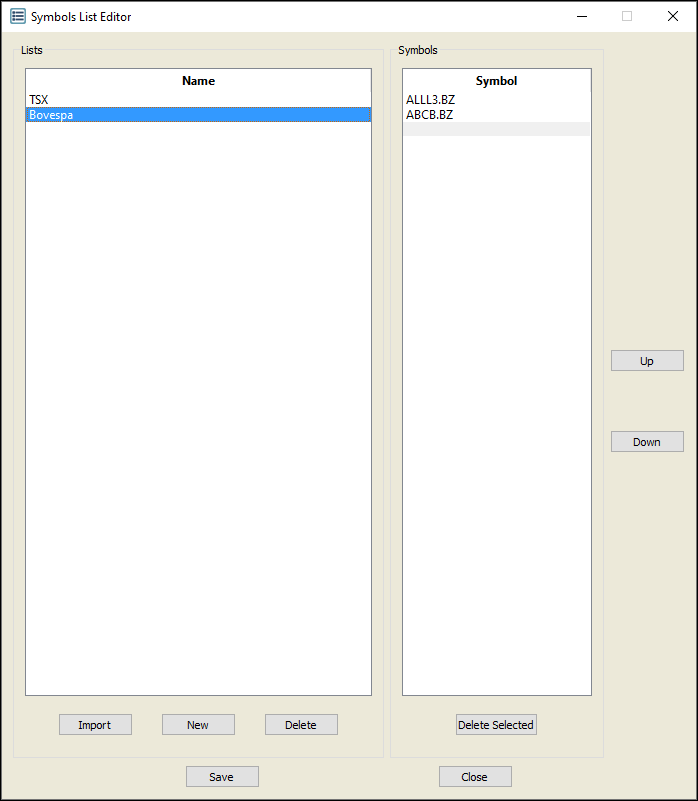
2. The Enter Symbol List Name window appears.
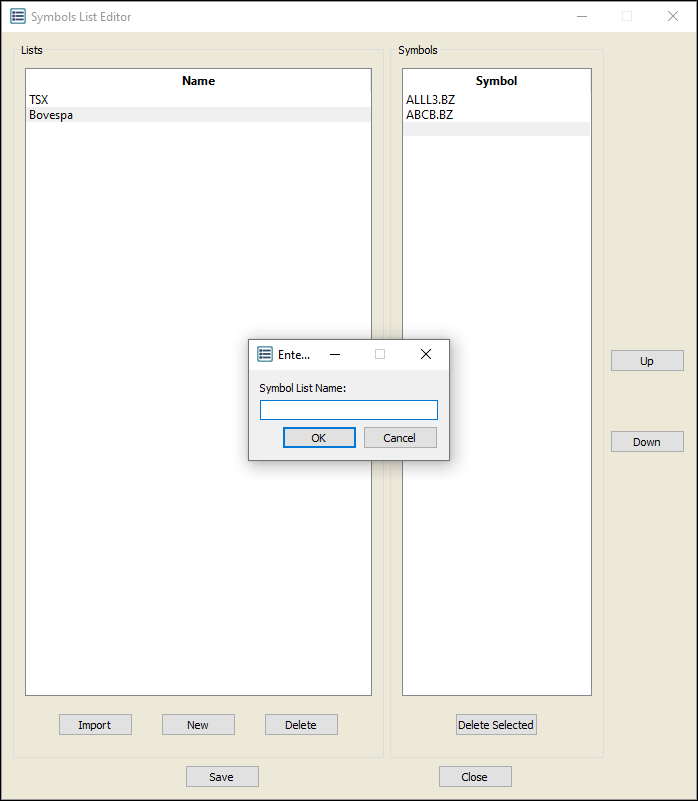
3. Type a new name for the symbol list, and then click OK.
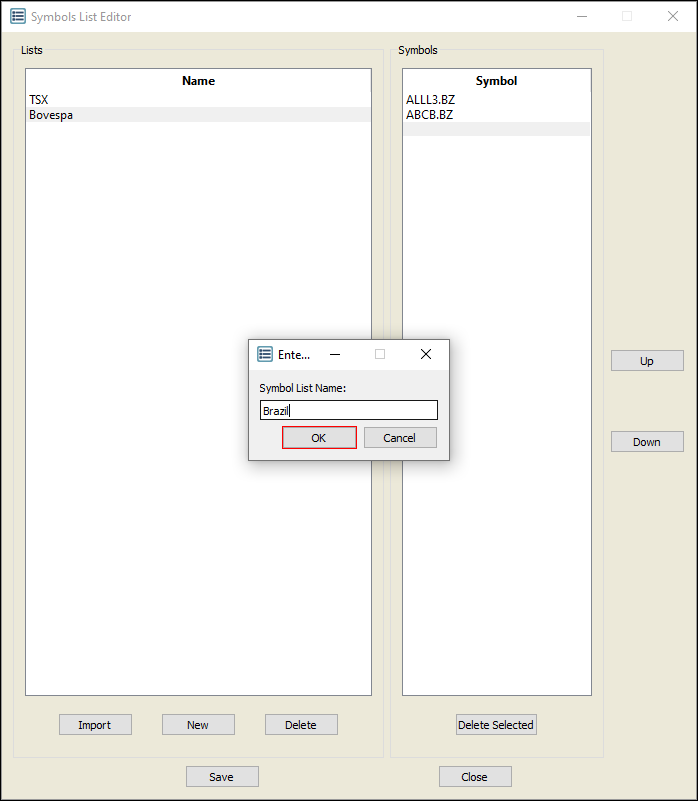
4. The new symbol list name appears.
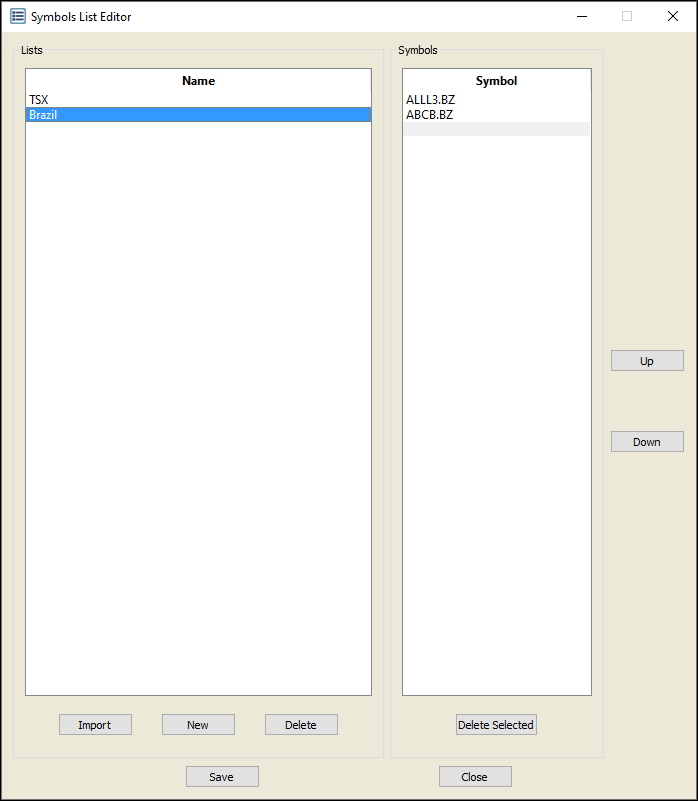
Edit a symbol
1. Click the symbol list that contains the symbol to be edited.
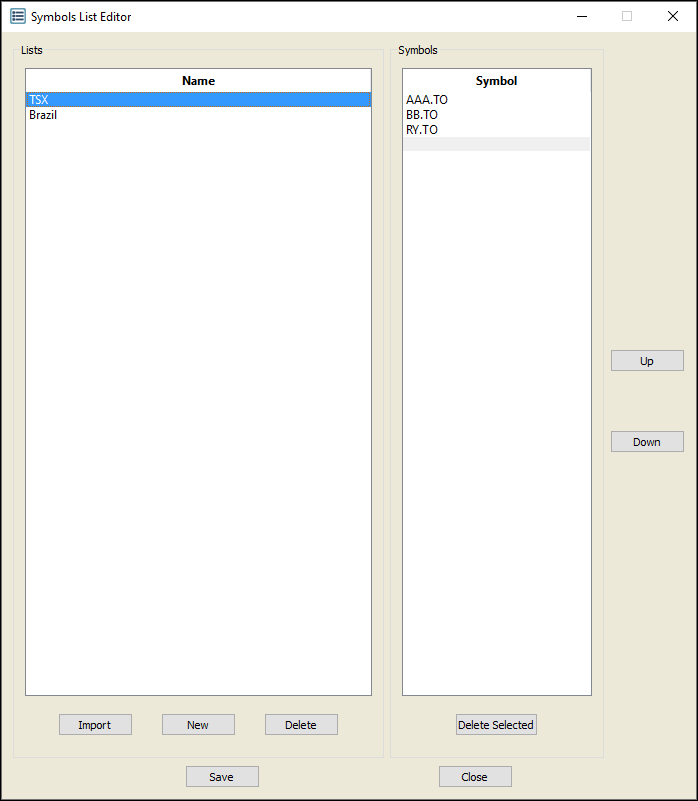
2. Double-click the symbol in the right pane.
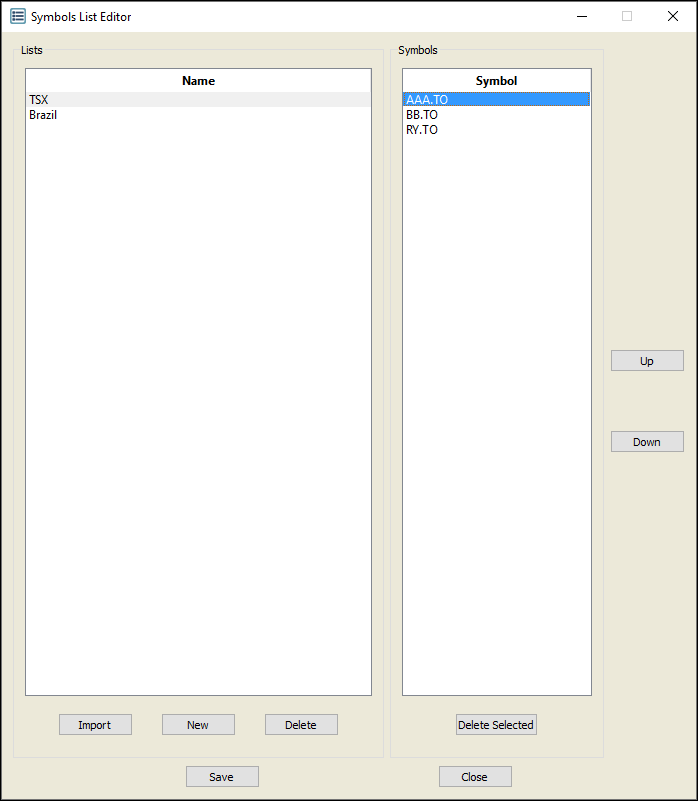
3. Type a new symbol in place of the selected symbol text.
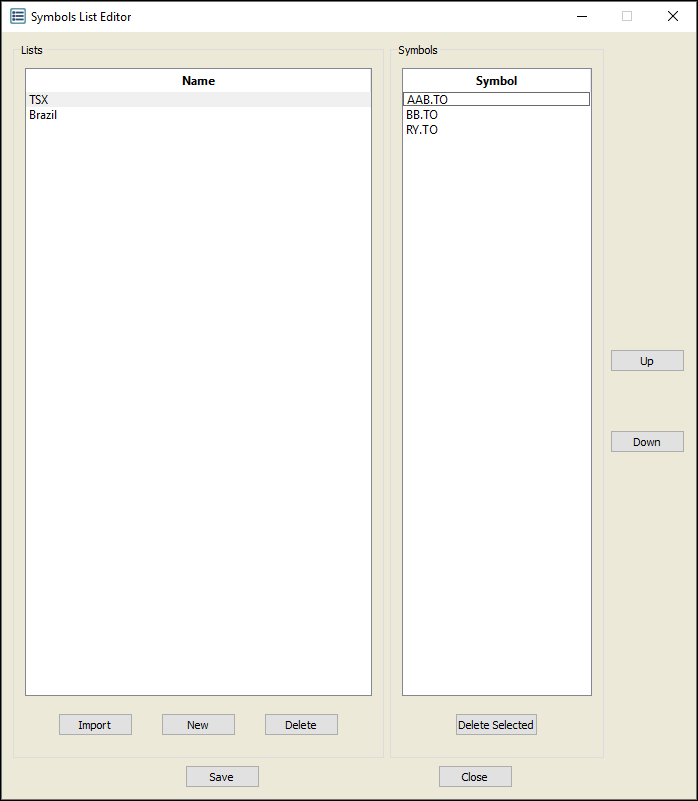
4. Press Enter.
5. The new symbol appears in the symbol list.
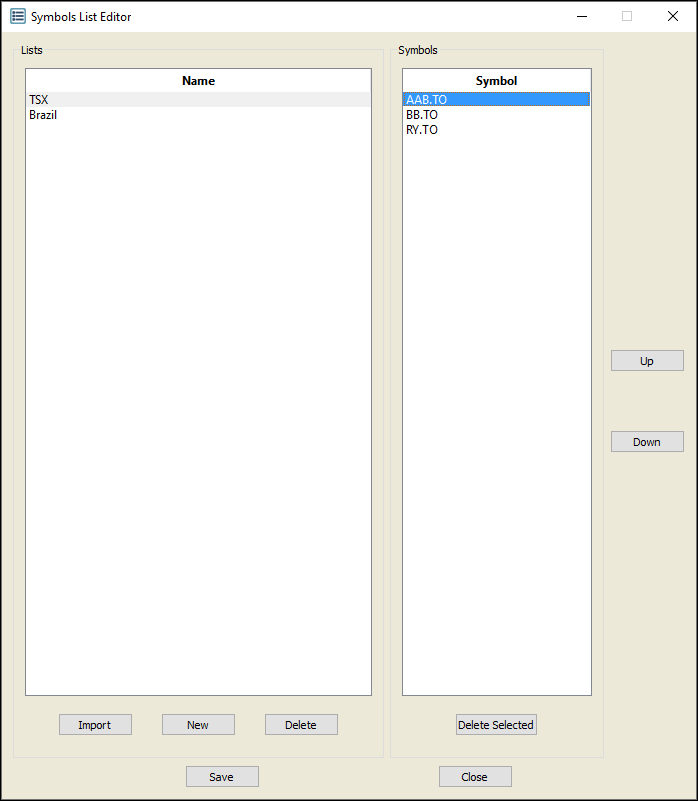
Import an existing symbol list in CSV file format
1. Click Import.
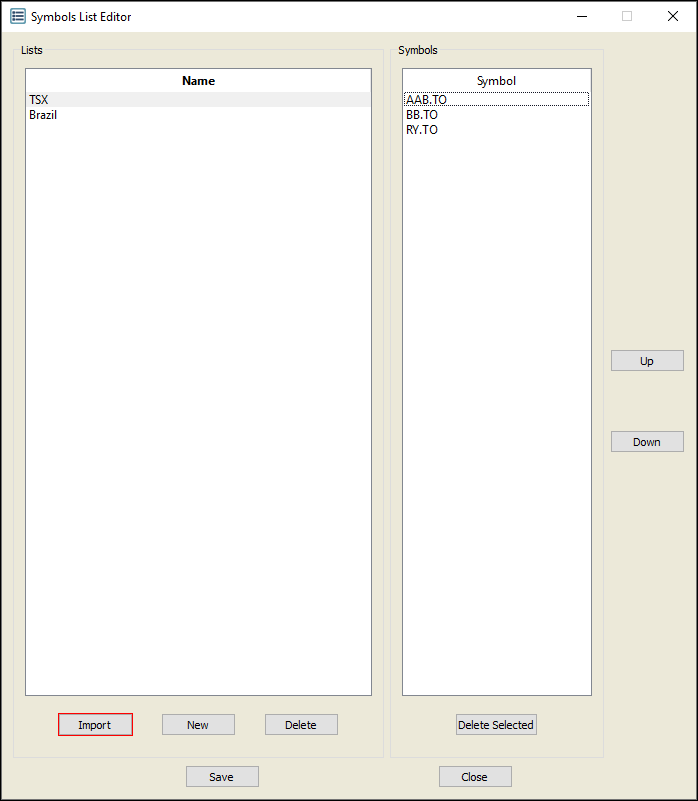
2. On your computer, find the CSV file that contains the symbol list.
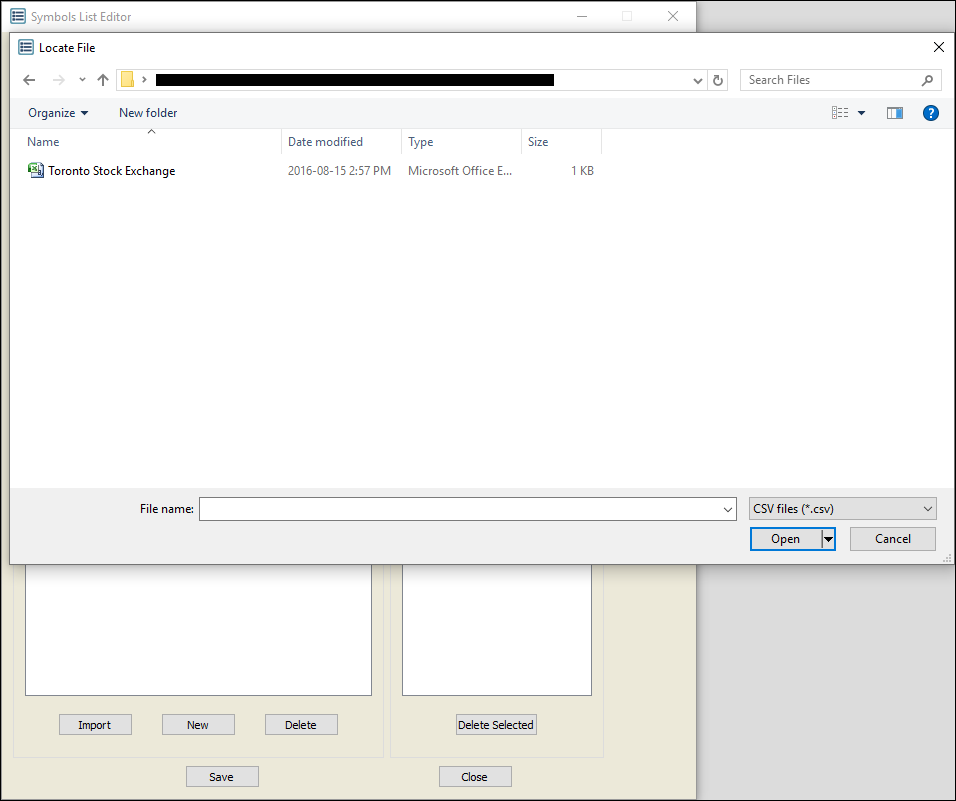
3. Double-click the file.
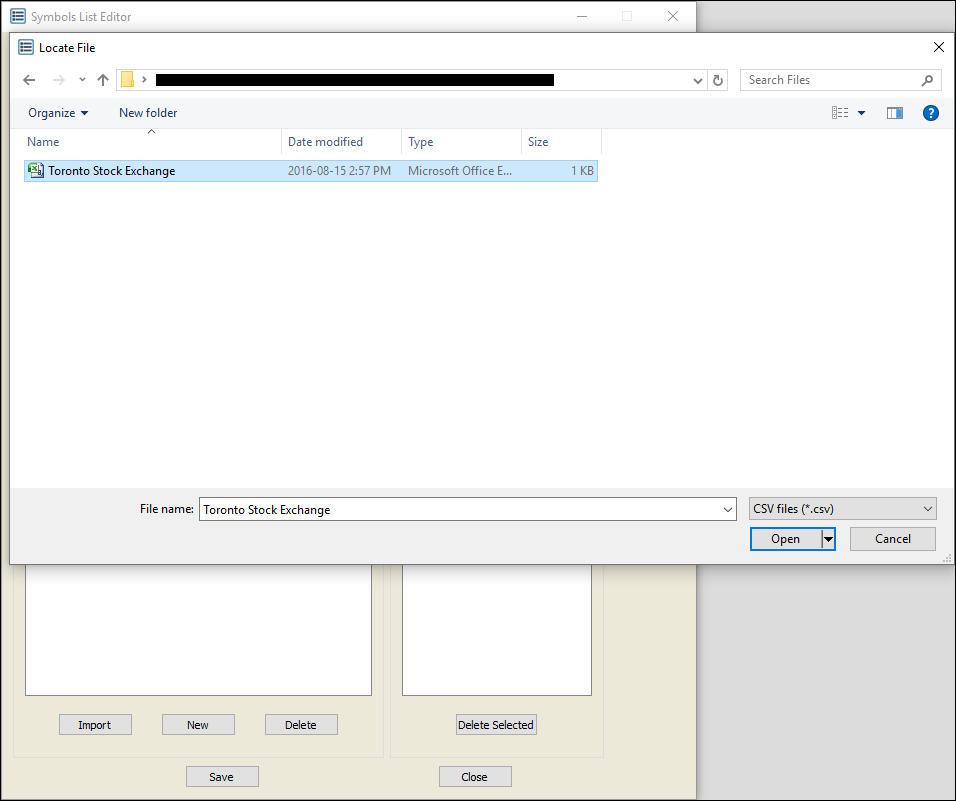
4. The symbol list is imported.
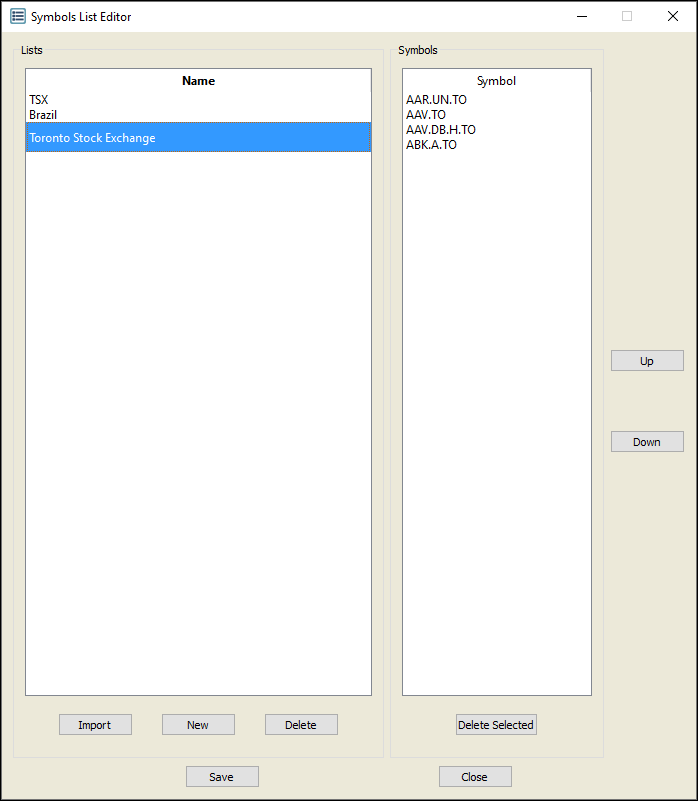
Insert symbols
1. Right-click anywhere in the blank space on the right under the open symbol list.
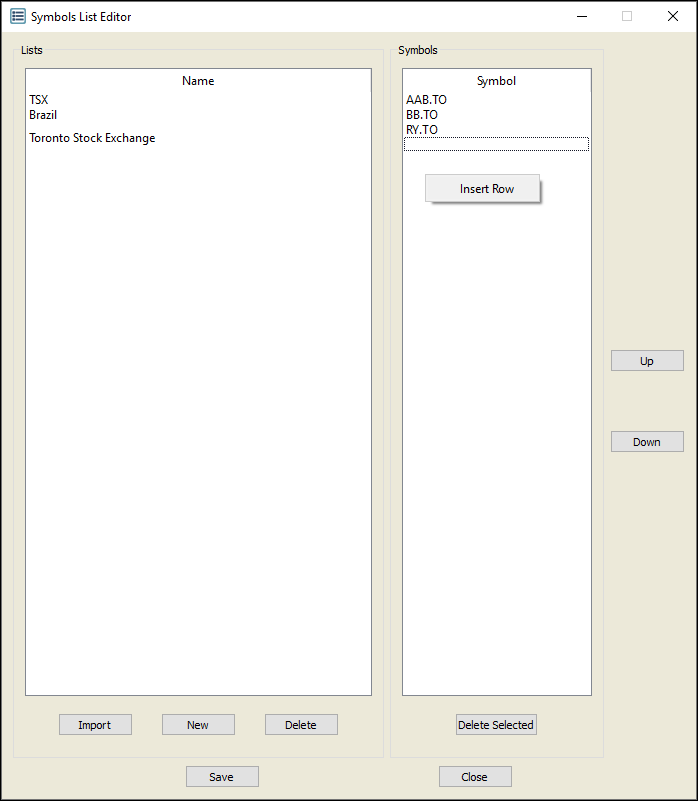
2. Click Insert Row.
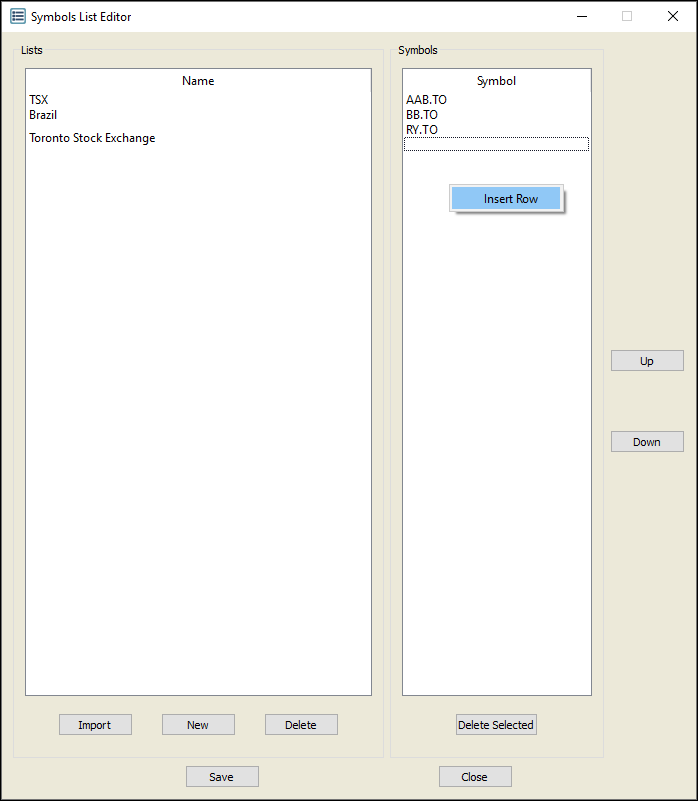
3. Type the symbol you wish to insert in the list.
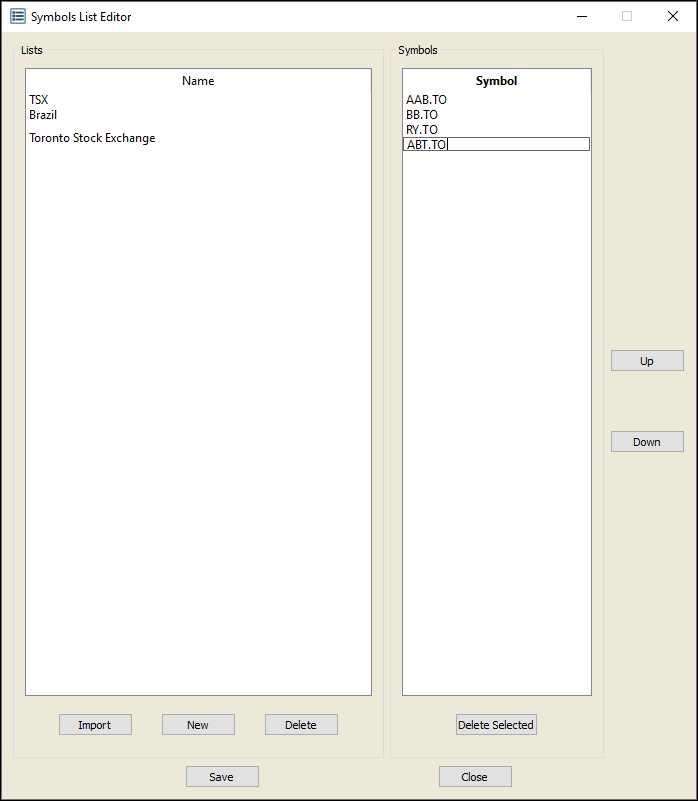
4. Press Enter.
5. The symbol is inserted.
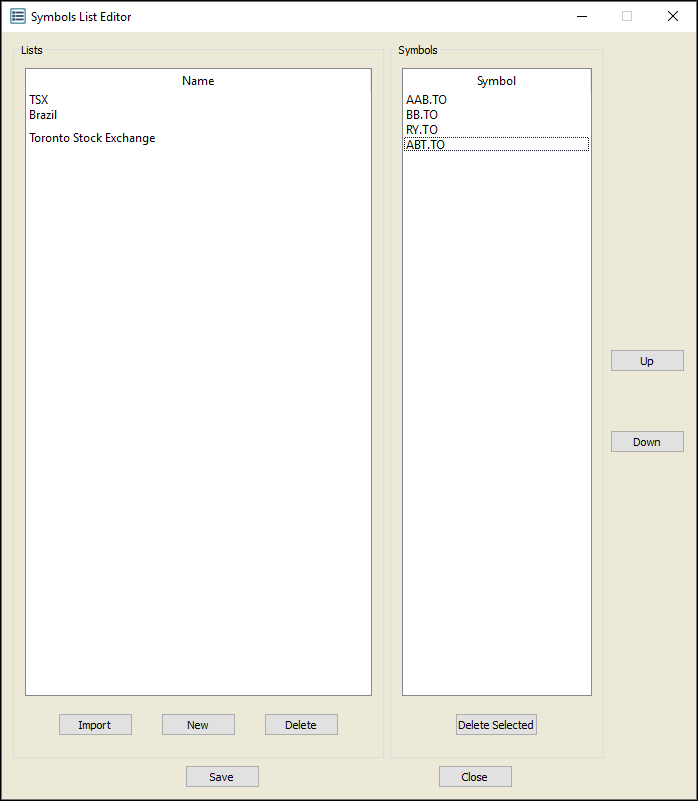
Sort symbols
1. Right-click a symbol.
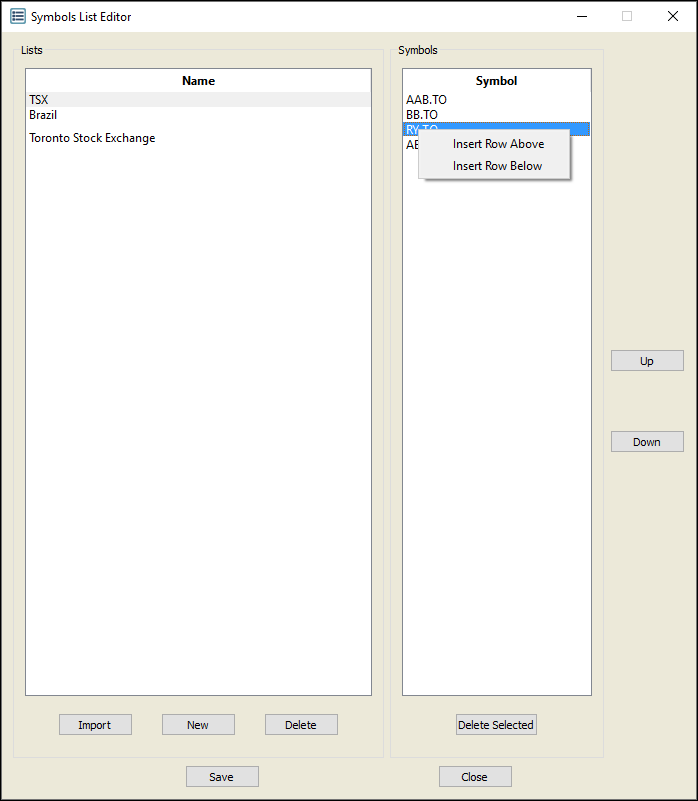
2. Click Insert Row Above or Insert Row Below.
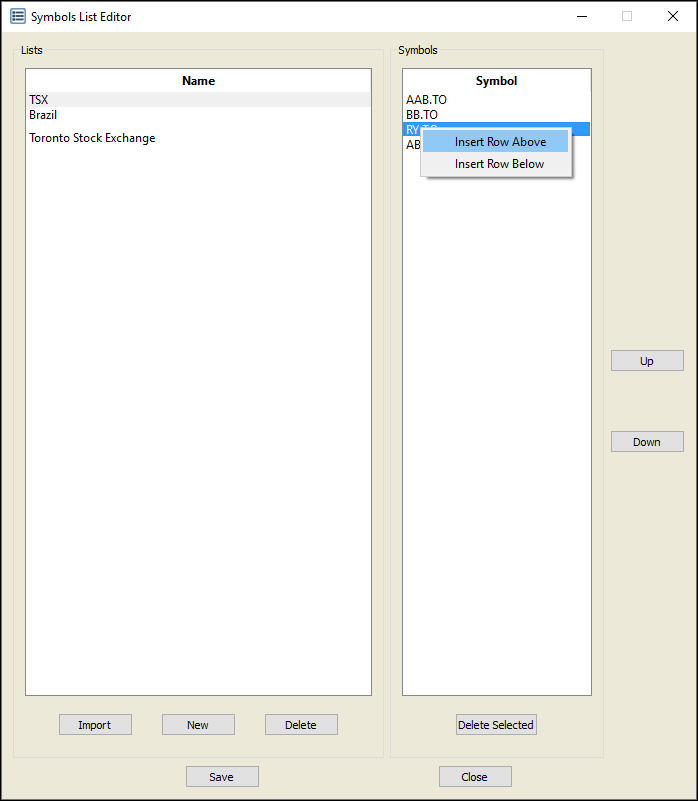
3. Type the symbol you wish to insert above or below.
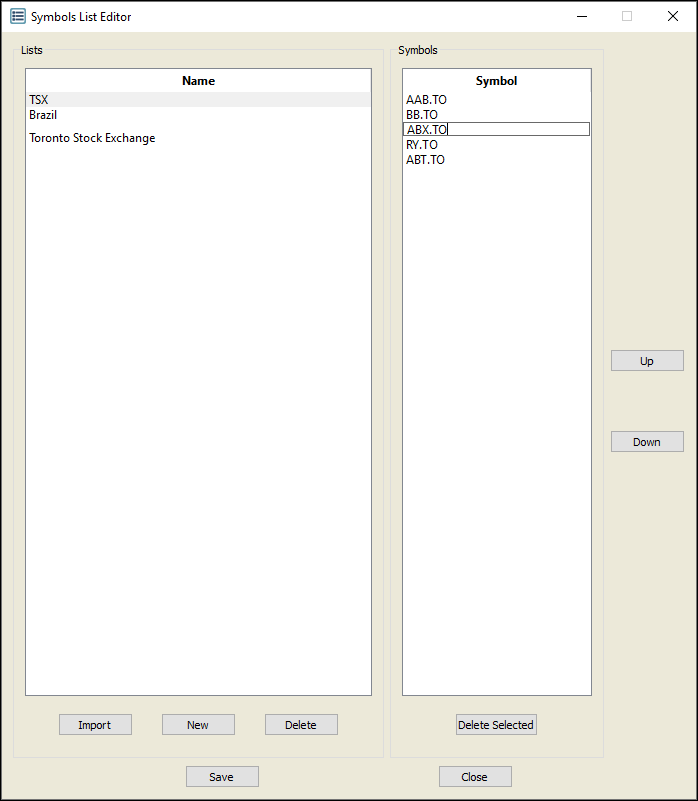
4. Press Enter.
5. The symbol is inserted.
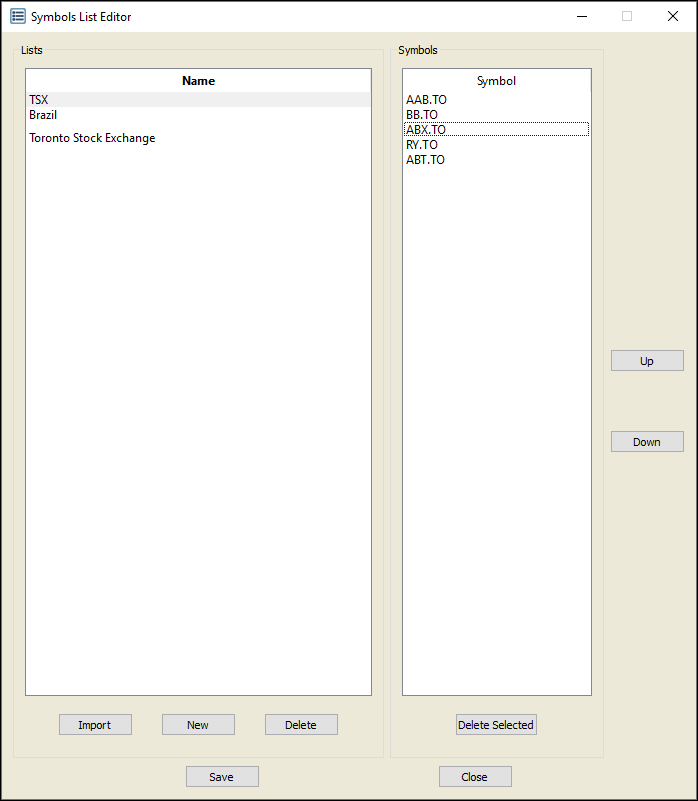
6. To move a symbol, click on it.
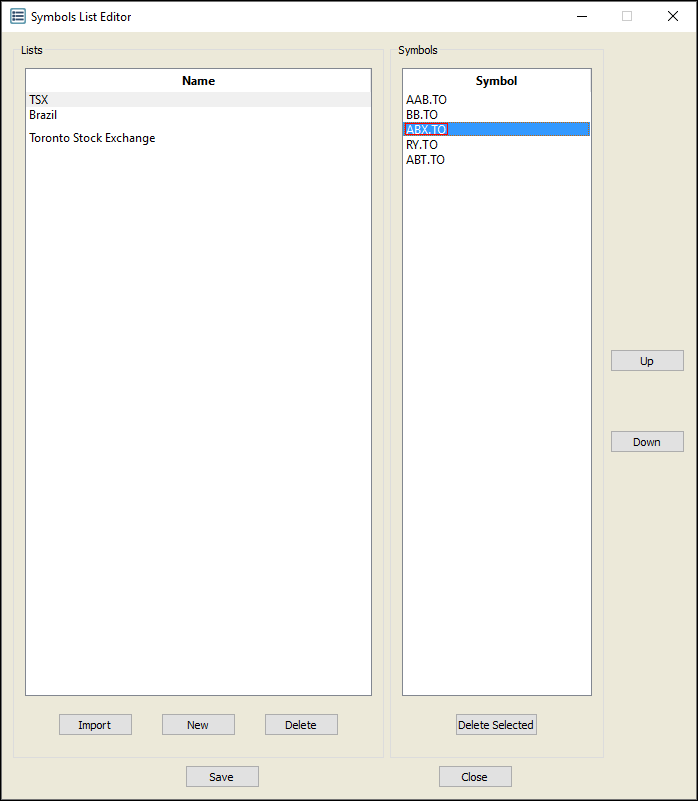
7. Click Up or Down.
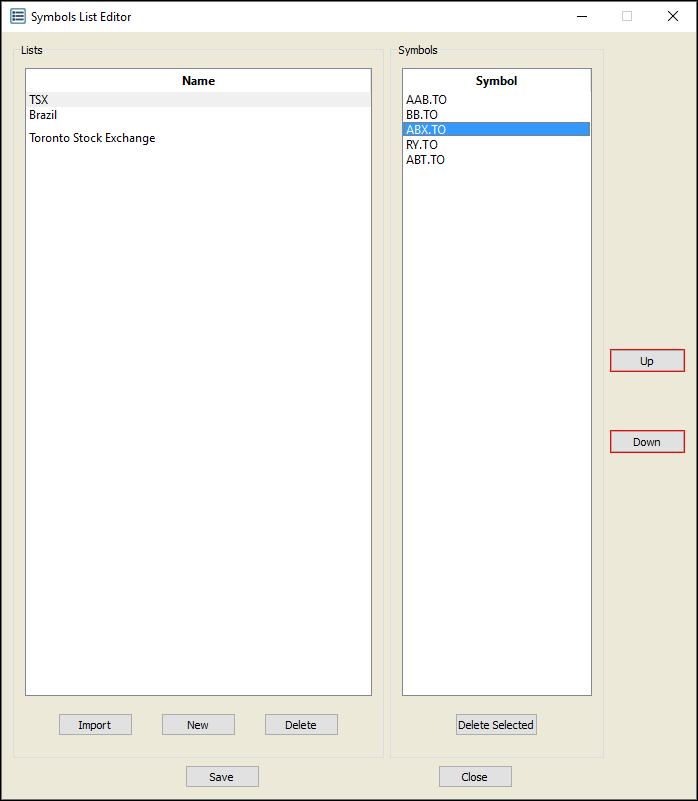
8. The symbol is sorted.
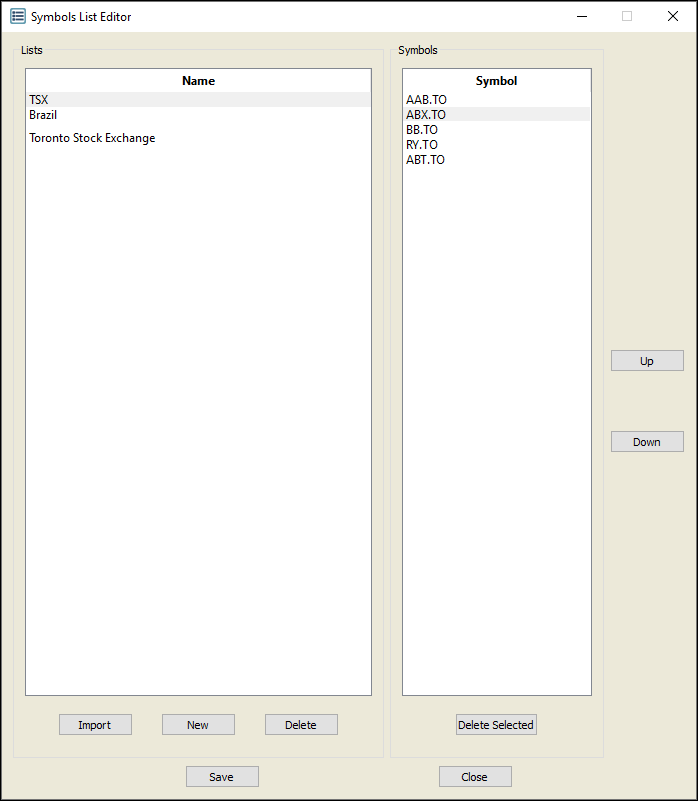
Delete symbols
1. Click the symbol you wish to remove. (Ctrl + click to select multiple symbols at once).
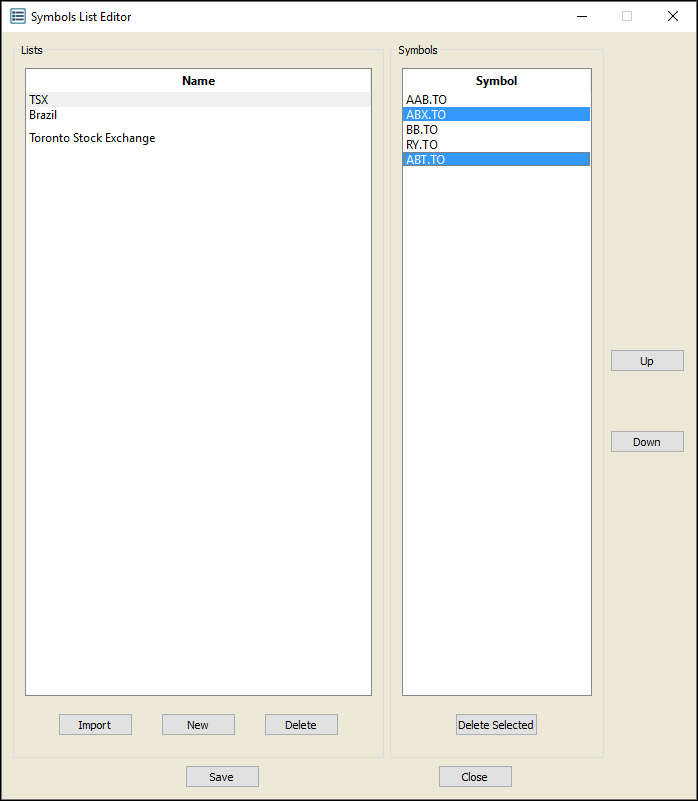
2. Click Delete Selected.
3. The symbols are deleted.
Delete a symbol list
1. Click the symbol list you wish to delete.
2. Click Delete.
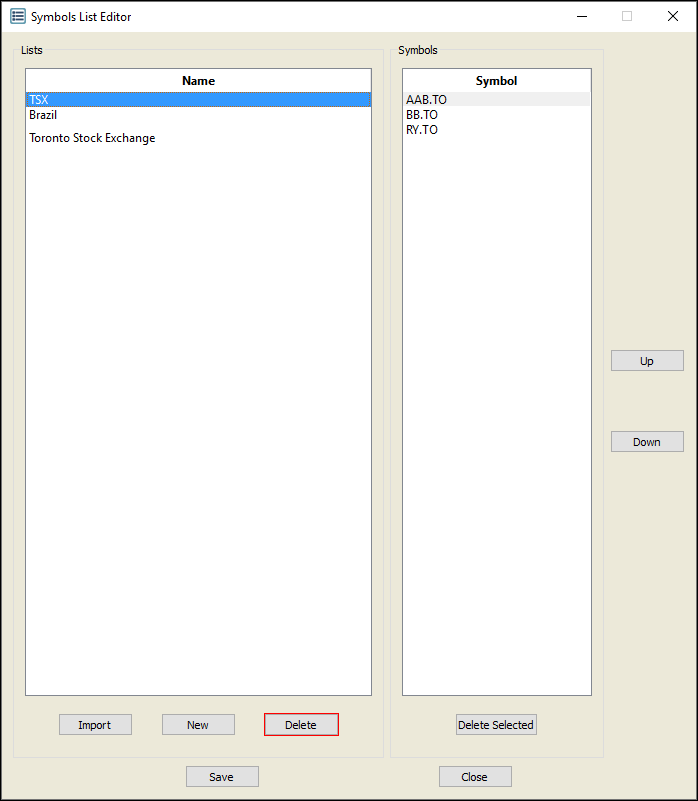
3. The Confirm Delete window appears. Click Yes.
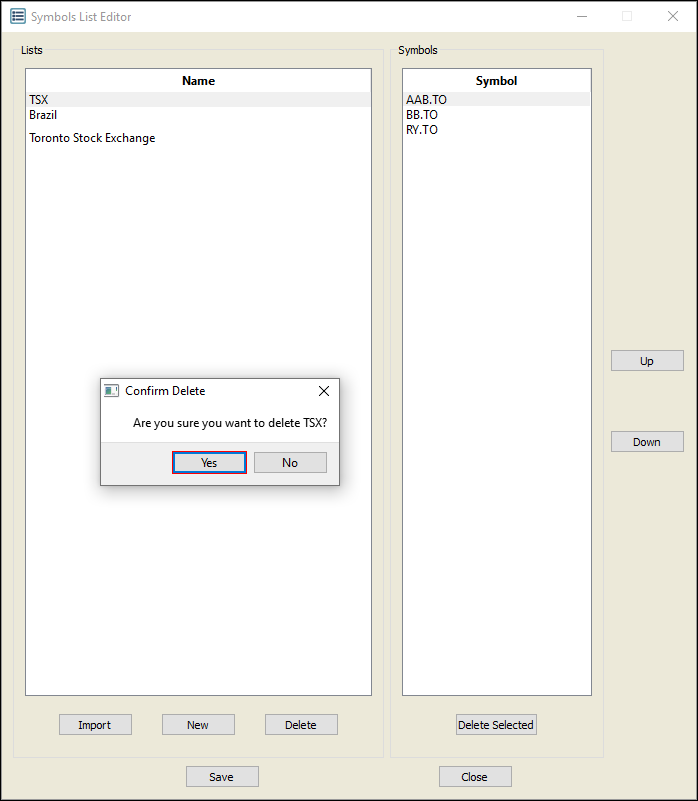
3. The symbol list is deleted.
>Back to Top
PPro8 Ticker
The PPro8 Ticker window displays data on a preset list of symbols.
Note: to view values for symbols in the Ticker window, first set up a symbol list in the Symbols List Editor.
Open a new Ticker window
1. On the PPro8 toolbar, click Ticker.

2. An empty Ticker window appears.
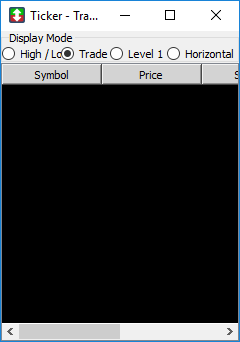
Set the display mode for a Ticker window
There are four different display modes available for the Ticker window: High / Low, Trade, Level 1, and Horizontal. Select an option to set the corresponding display mode.
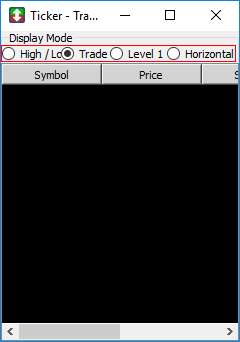
- High / Low: this mode shows new highs or lows on a list of symbols. When the High / Low mode is set, the Ticker window displays Symbol, Price, Change, and Time.
- Trade: this mode shows all trades on the list of symbols being monitored, much like the Time of Sales window. When the Trade mode is set, the Ticker window displays Symbol, Price, Shares, and Time.
- Level 1: this mode shows Level 1 data on a list of symbols. When the Level 1 mode is set, the Ticker window displays Symbol, Bid, Ask, Bid Size, and Ask Size.
- Horizontal: this mode shows ticker information horizontally on a list of symbols. When the Horizontal mode is set, the Ticker window displays Symbol, Price, Tick, and Percentage Change.
Ticker Window Customization
To make changes to the Ticker window settings, right-click anywhere in the Ticker window to open the Ticker Customization window. This window displays five main tabs on the left: High/Low, Level 1, Trade, Horizontal, and Common.
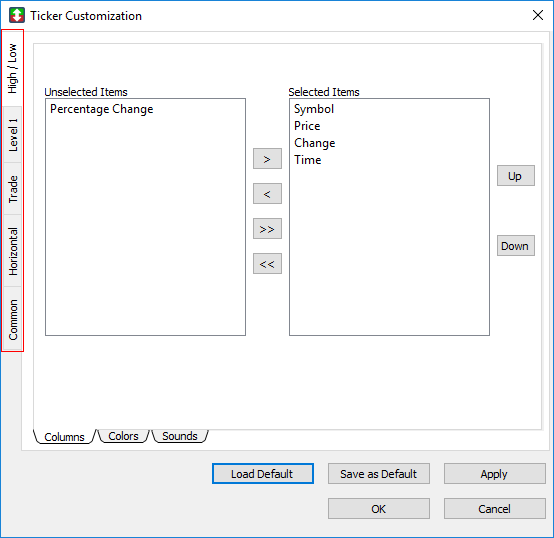
High/Low
Use the High/Low window to set the high/low settings for the Ticker window.
- Click the High/Low tab to open the High/Low window.
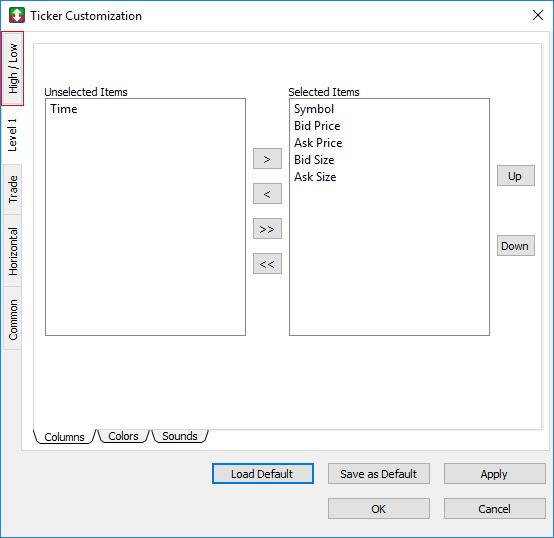
The High/Low window contains three sub-tabs: Columns, Colors, and Sounds.
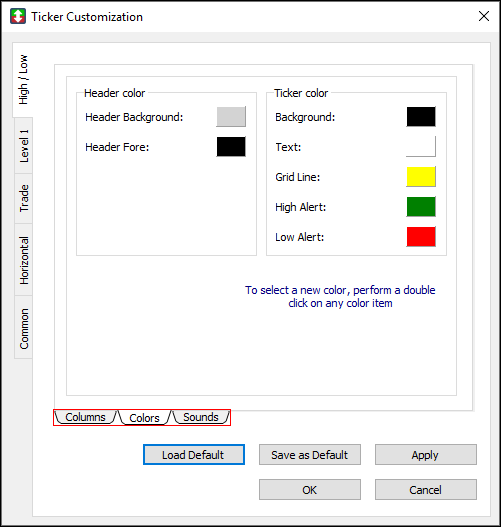
Columns
Use the Columns window to show or hide columns in High / Low mode.
1. Click the Columns sub-tab.
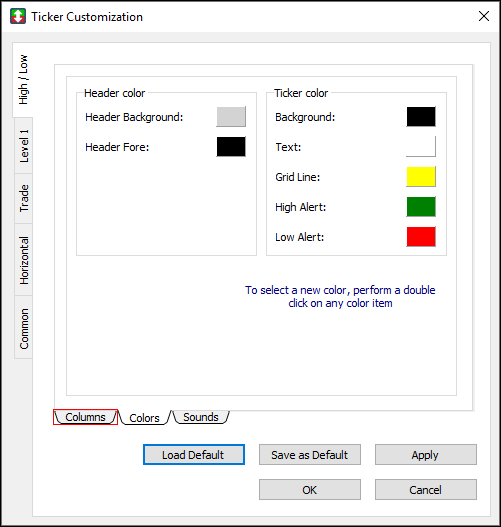
2. The Columns window appears.
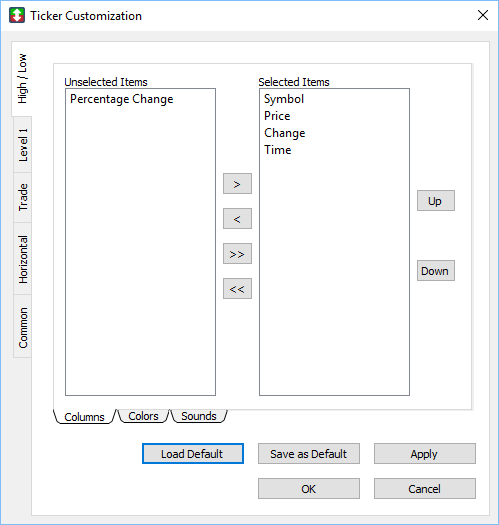
Show a column in High / Low mode
1. Click an item in the Unselected items list.
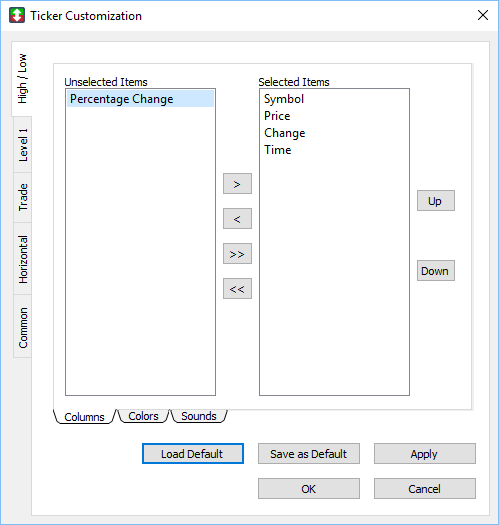
2. Click the right arrow to move the item to the Selected items list.
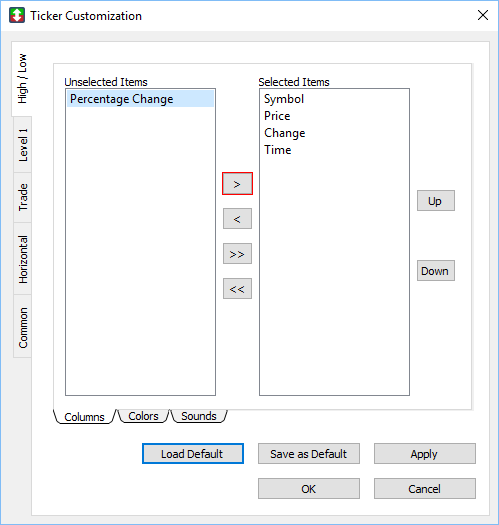
3. Click OK.
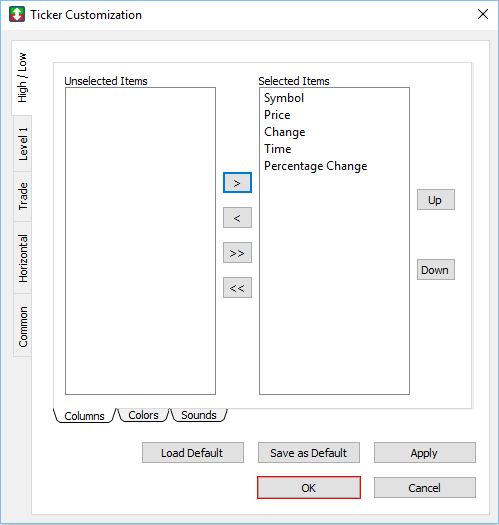
4. The column appears in the Ticker window.
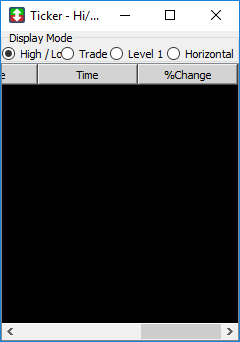
Hide a column from High / Low mode
1. In the Columns window, click an item in the Selected items list.
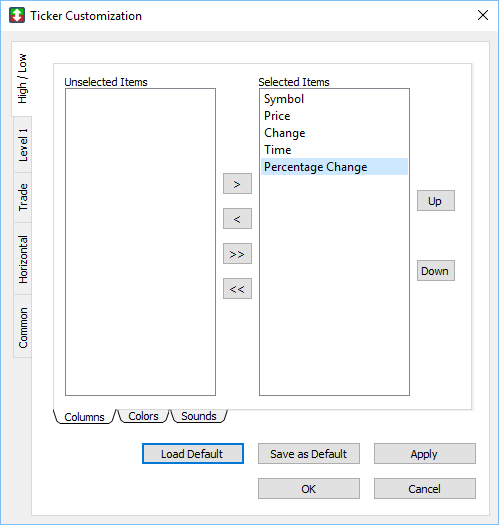
2. Click the left arrow to move the item to the Unselected items list.
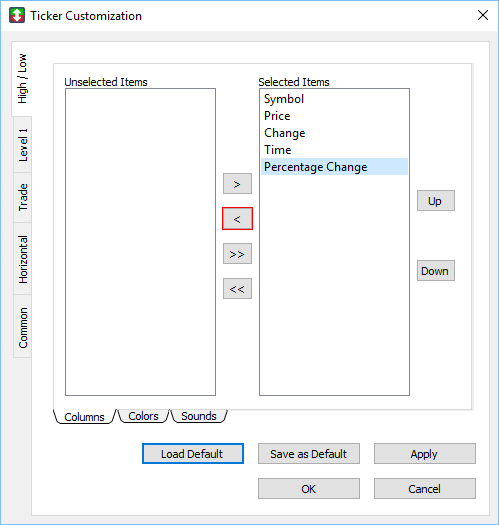
3. Click OK.
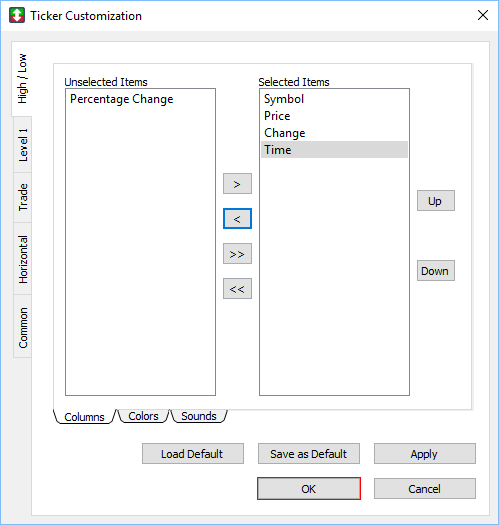
4. The column is hidden from the Ticker window.
Colors
Use the Colors window to set the colors for the header and ticker in High / Low mode.
1. Click the Colors sub-tab.
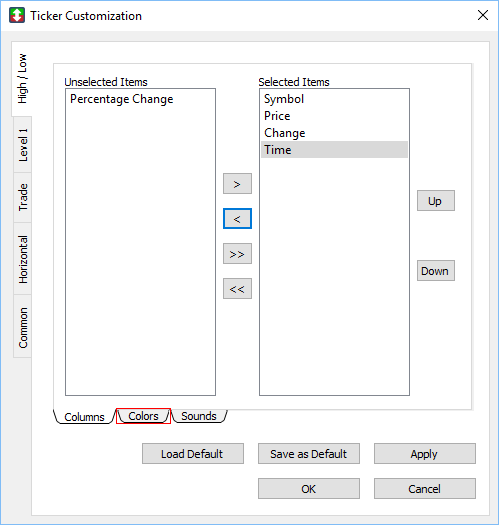
2. The Colors window appears.
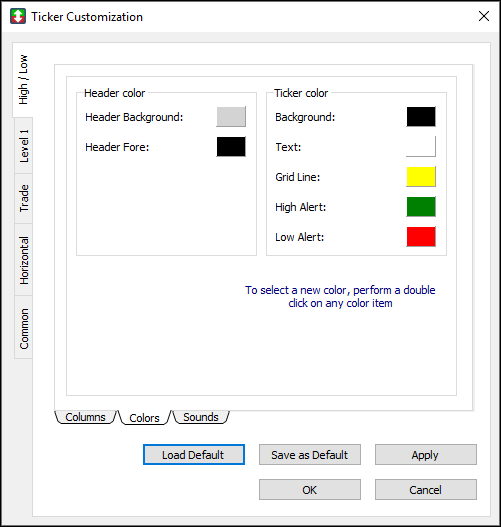
Set a color in High / Low mode
1. Double-click the color box next to a feature, for example, Header Background under the Header Color heading.
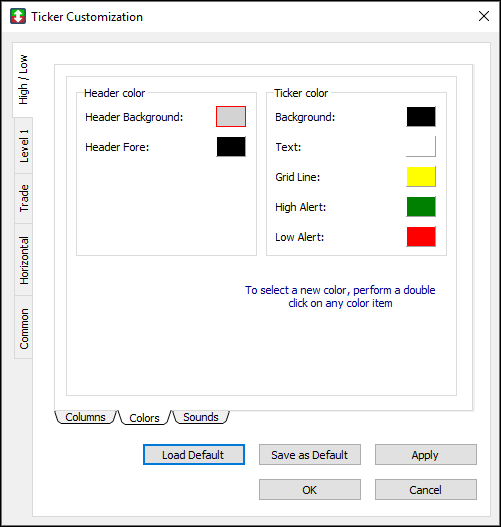
2. The Color Selector window appears. Click a color, and then click OK.
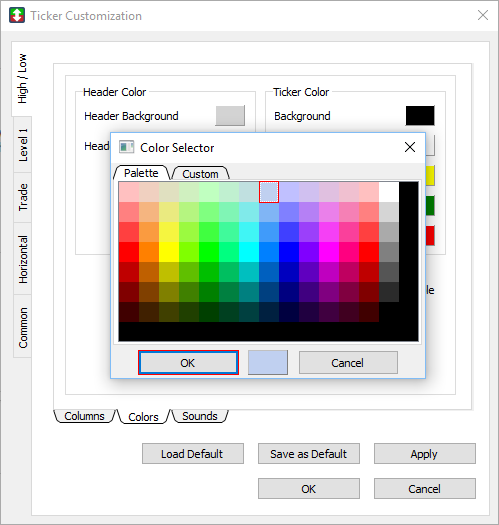
3. In the Colors window, click OK.
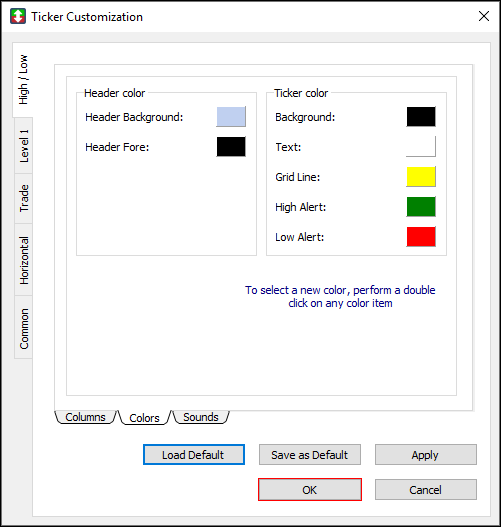
4. The color is set.
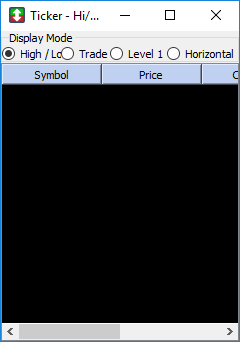
Sounds
Use the Sounds window to enable sound effects for alerts when alert conditions are met.
1. Click the Sounds sub-tab.
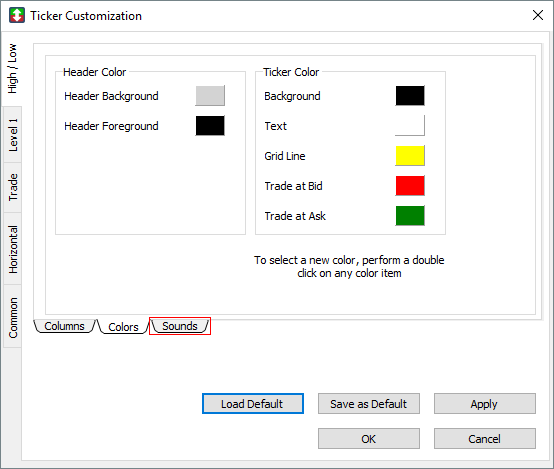
2. The Sounds window appears.
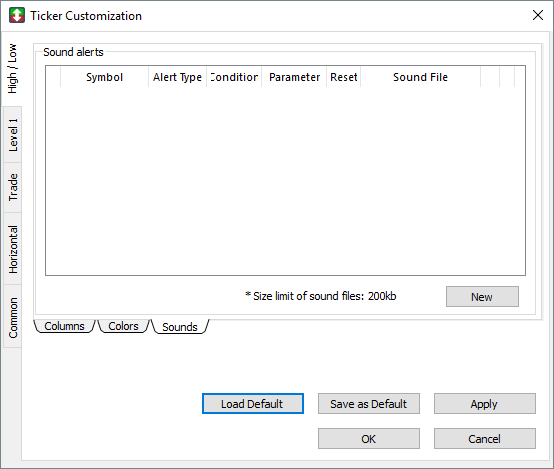
Set a sound effect
1. In the Sounds window, click the New button.
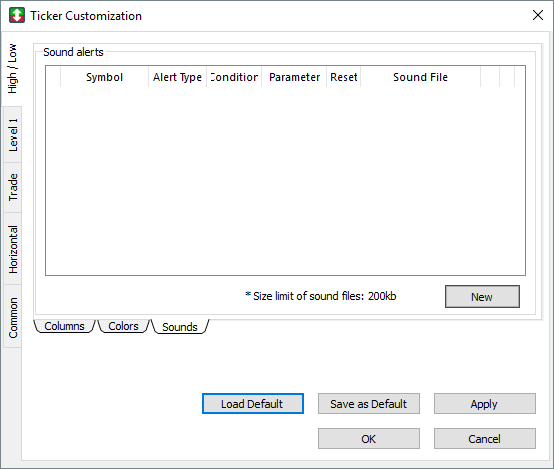
2. A table row appears.
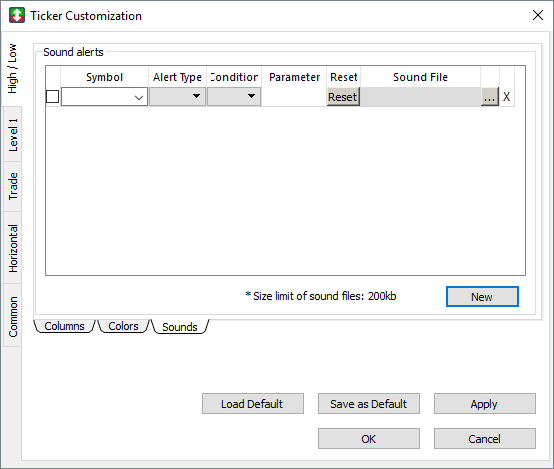
3. Type a Symbol, click an Alert Type, click a Condition, and then type a Parameter value for the symbol.
4. Click the (…) button, click a WAV sound file in the media folder, and then click Open.
5. Select the check box for the symbol, and then click OK.
6. The alert sound effect is set.
7. To reset an alert, click the Reset button.
Level 1
Use the Level 1 window to show Level 1 data in the Ticker window.
- Click the Level 1 tab to open the Level 1 window.
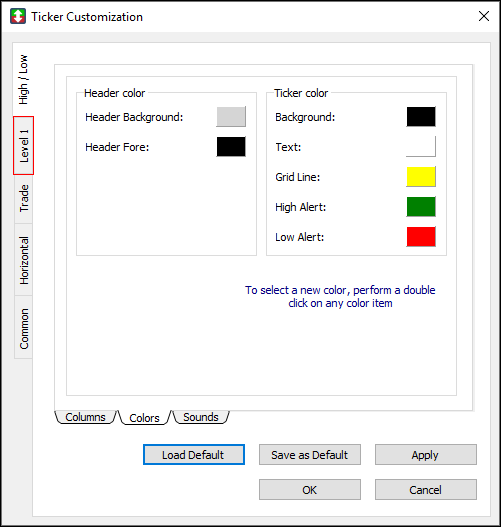
The Level 1 window contains three sub-tabs: Columns, Colors, and Sounds.
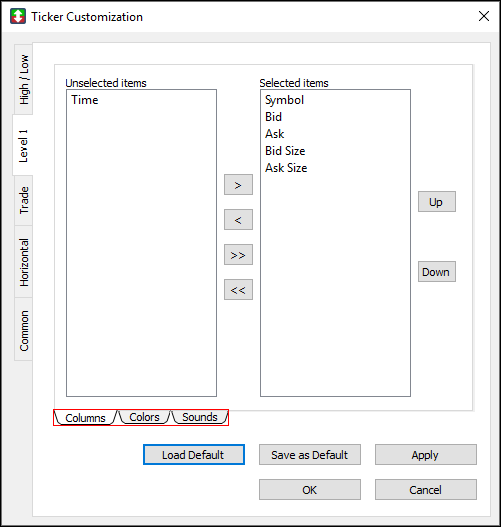
Columns
Use the Columns window to show or hide columns in Level 1 mode.
1. Click the Columns sub-tab.
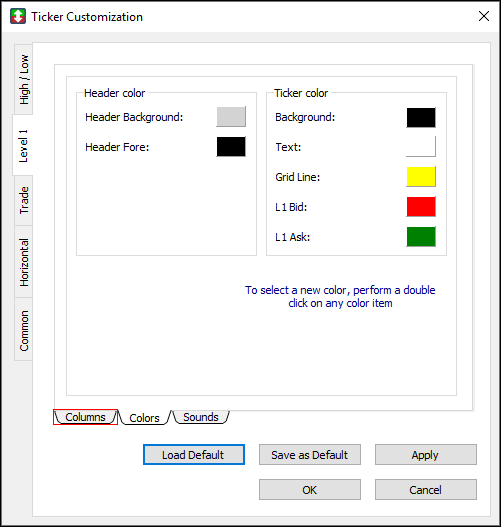
2. The Columns window appears.
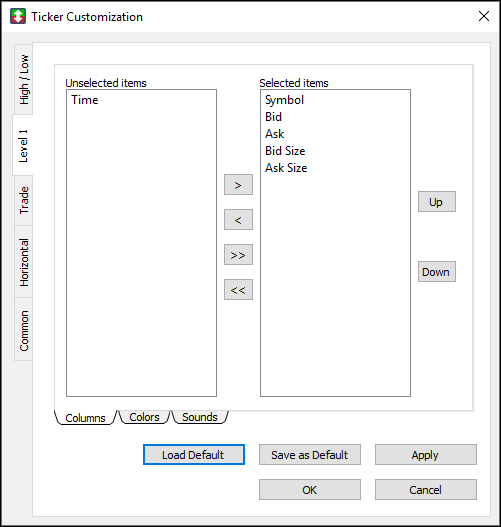
Show a column in Level 1 mode
1. Click an item in the Unselected items list.
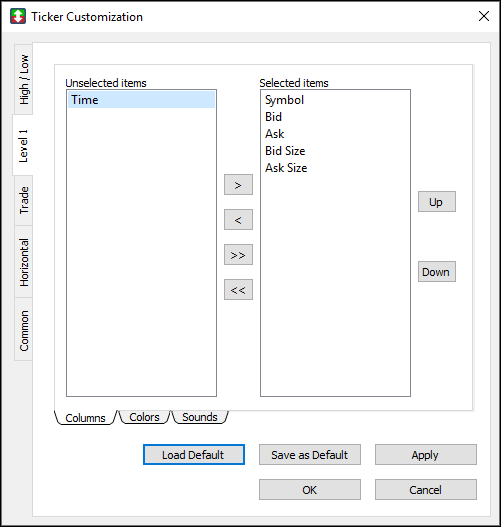
2. Click the right arrow to move the item to the Selected items list.
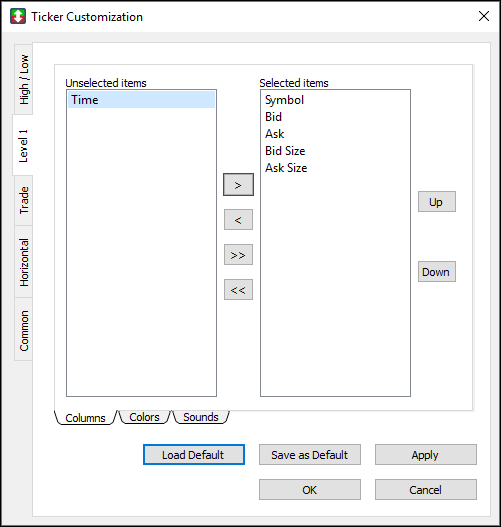
3. Click OK.
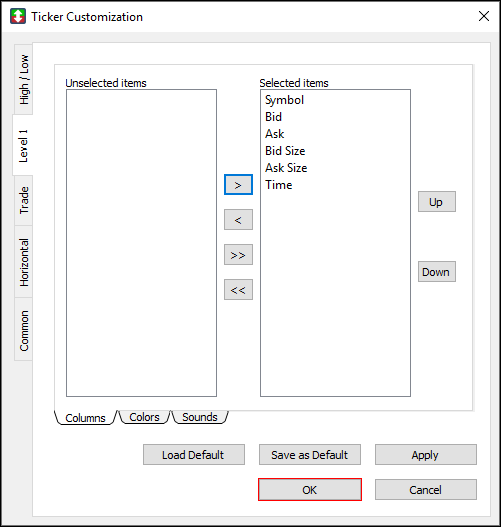
4. The column appears in the Ticker window.
Hide a column from Level 1 mode
1. Click an item in the Selected items list.
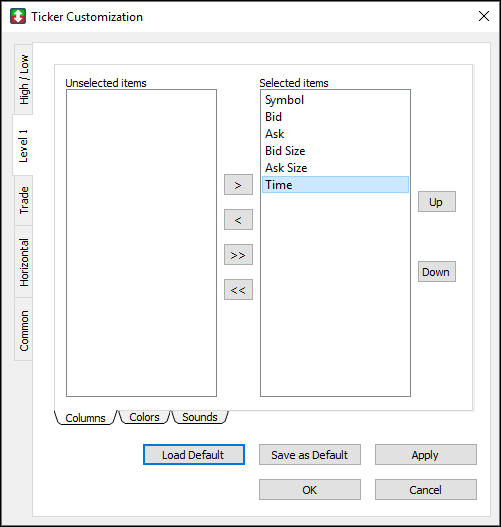
2. Click the left arrow to move the item to the Unselected items list.
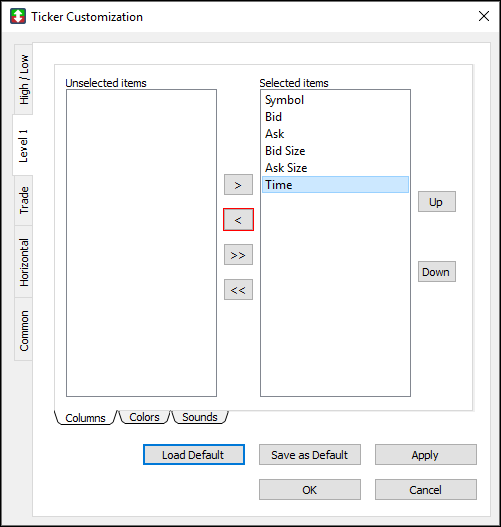
3. Click OK.
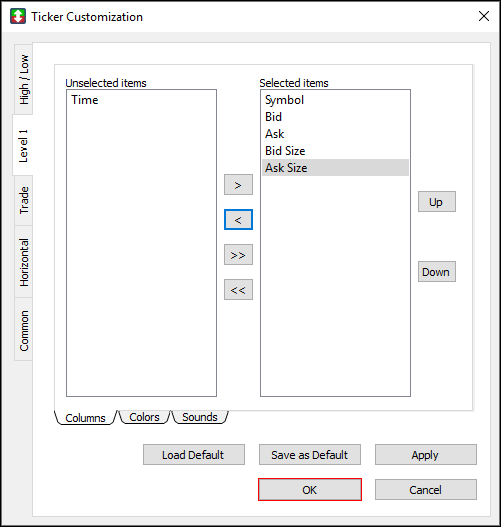
4. The column is hidden from the Ticker window.
Colors
Use the Colors window to set the colors for the header and ticker in Level 1 mode.
1. Click the Colors sub-tab.
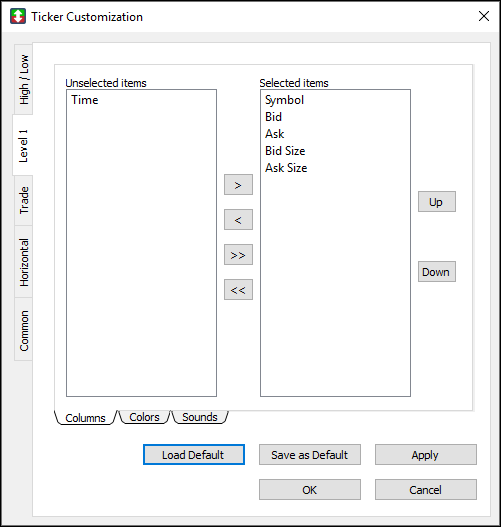
2. The Colors window appears.
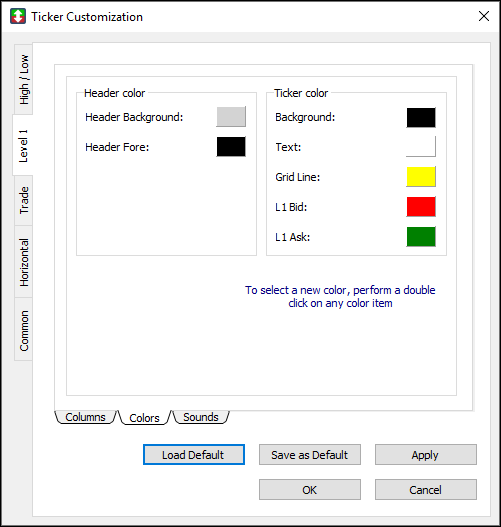
Set a color in Level 1 mode
1. Double-click the color box next to a feature, for example, L1 Bid under the Ticker color heading.
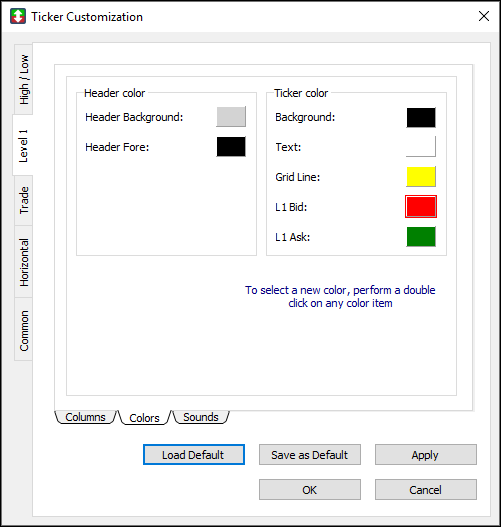
2. The Color Selector window appears. Click a color, and then click OK.
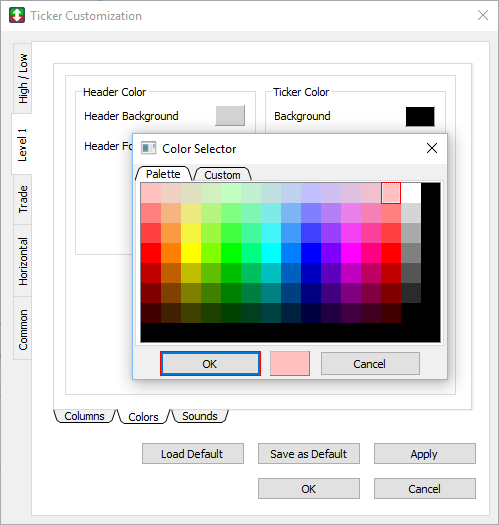
3. In the Color window, click OK.
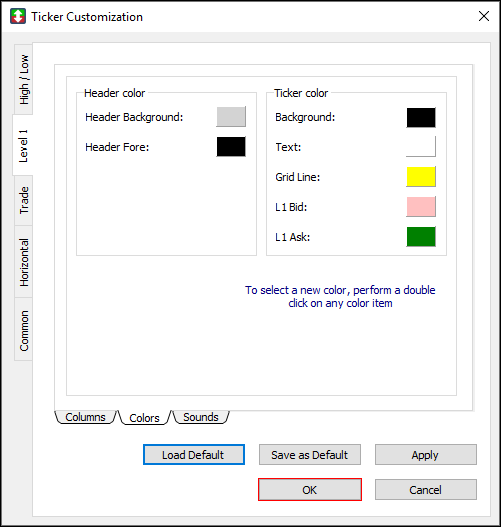
4. The color is set.
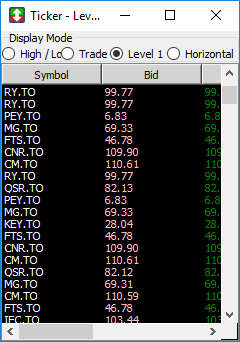
Sounds
Use the Sounds window to enable sound effects for alerts when alert conditions are met.
1. Click the Sounds sub-tab.
2. The Sounds window appears.
Set a sound effect
1. In the Sounds window, click the New button.
2. A table row appears.
3. Type a Symbol, click an Alert Type, click a Condition, and then type a Parameter value for the symbol.
4. Click the (…) button, click a WAV sound file in the media folder, and then click Open.
5. Select the check box for the symbol, and then click OK.
6. The alert sound effect is set.
7. To reset an alert, click the Reset button.
Trade
Use the Trade window to filter data, show columns, and set colors for the Ticker window’s Trade mode.
- Click the Trade tab to open the Trade window.
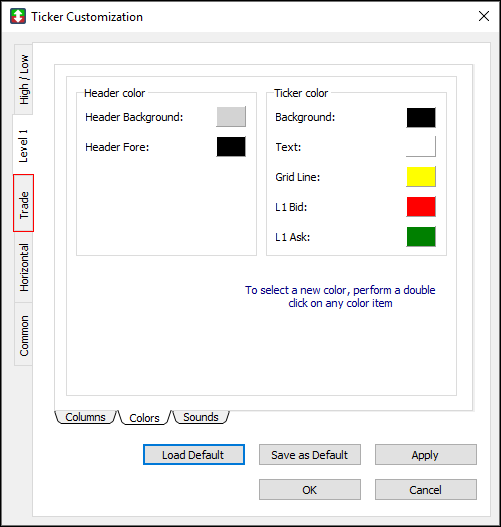
The Trade window contains three sub-tabs: Columns, Colors, and Sounds.
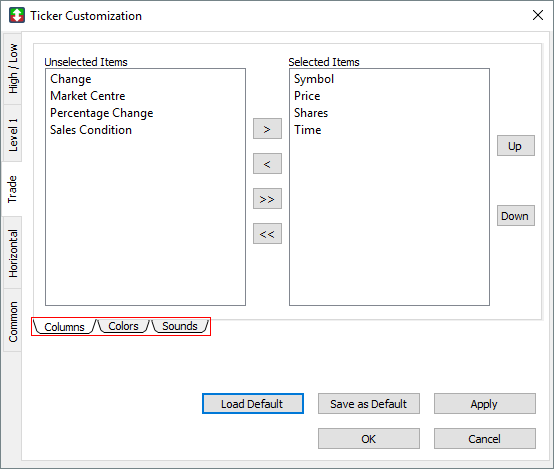
Columns
Use the Columns window to show or hide columns in Trade mode.
1. Click the Columns sub-tab.
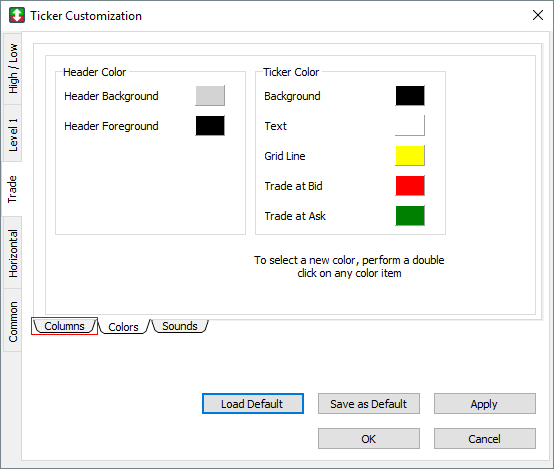
2. The Columns window appears.
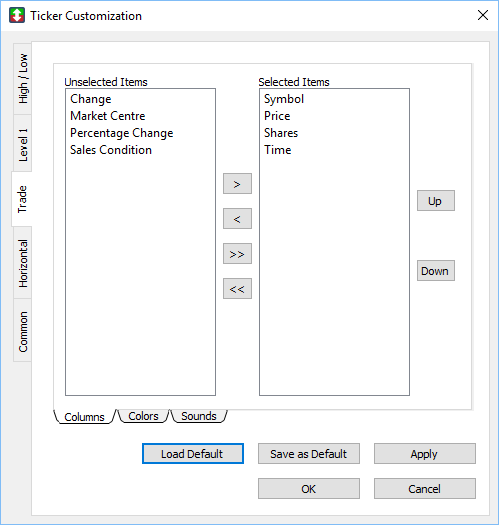
Show a column in Trade mode
1. Click an item in the Unselected items list.
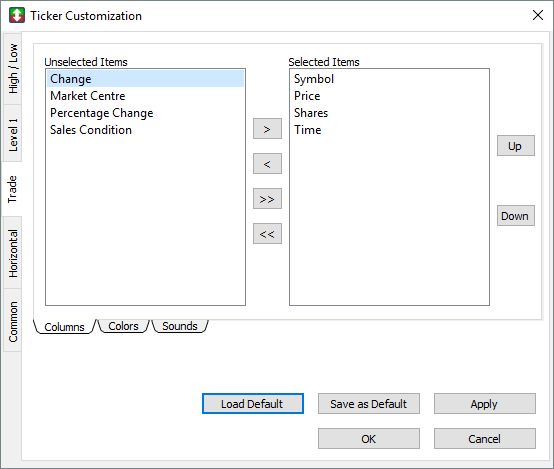
2. Click the right arrow to move the item to the Selected items list.
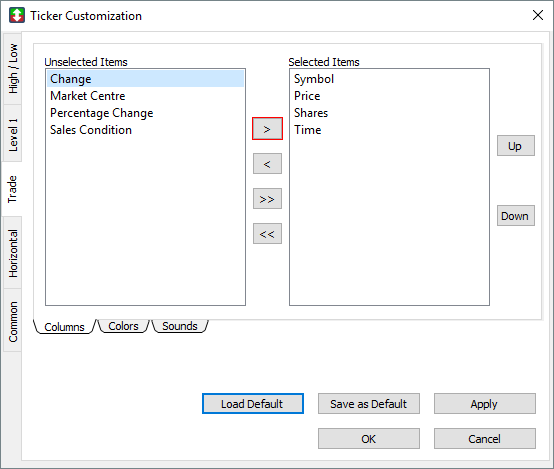
3. Click OK.
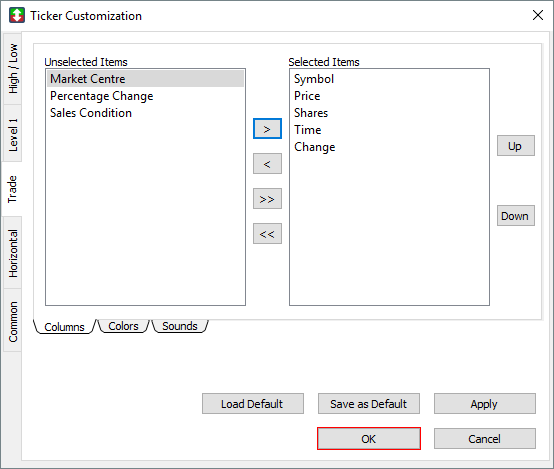
4. The column appears in the Ticker window.
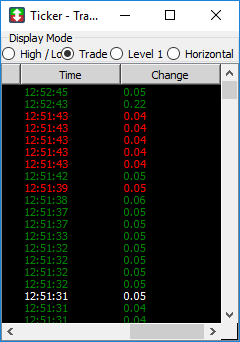
Hide a column from Trade mode
1. Click an item in the Selected items list.
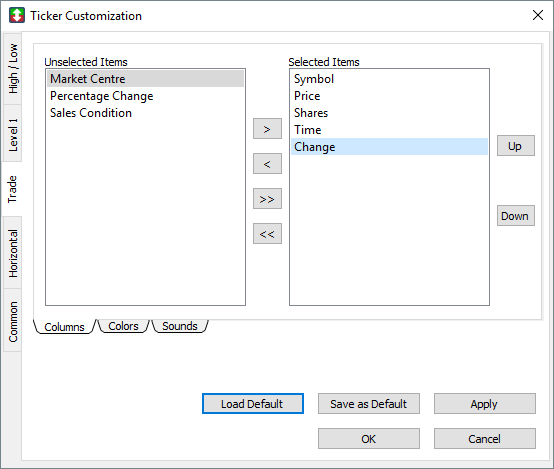
2. Click the left arrow to move the item to the Unselected items list.
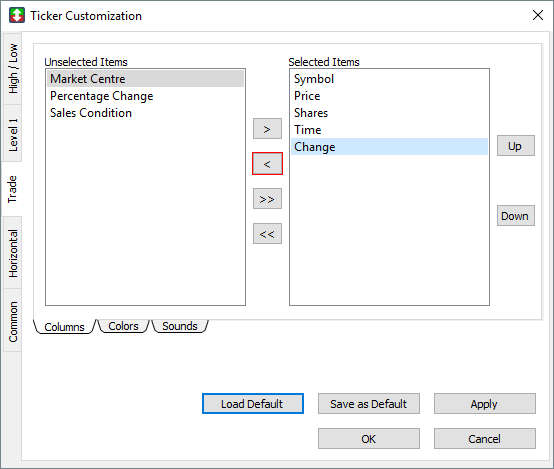
3. Click OK.
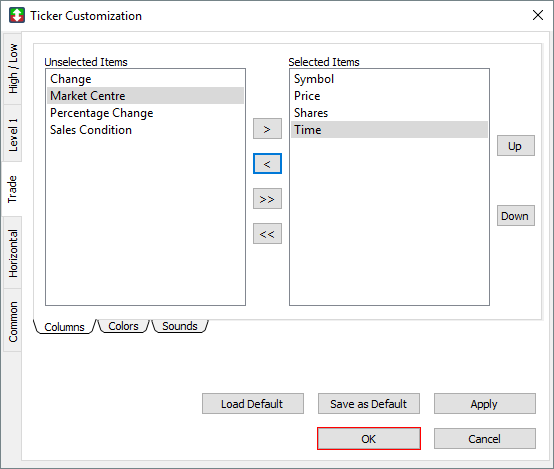
4. The column is hidden from the Ticker window.
Colors
Use the Colors window to set the colors for the header and ticker in Trade mode.
1. Click the Colors sub-tab.
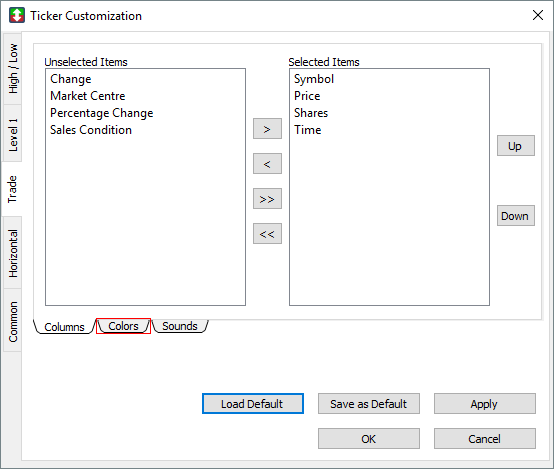
2. The Colors window appears.
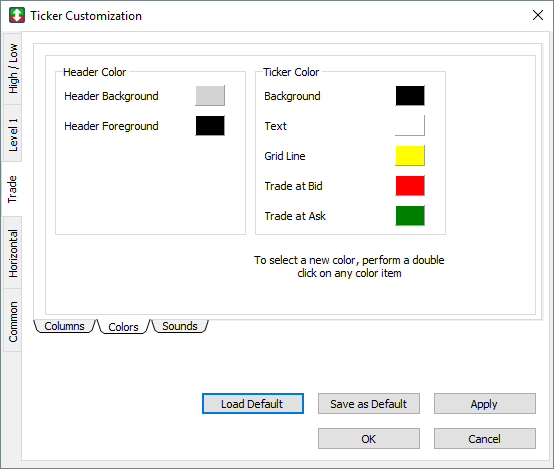
Set a color in Trade mode
1. Double-click the color box next to a feature, for example, Trade At Bid under the Ticker color heading.
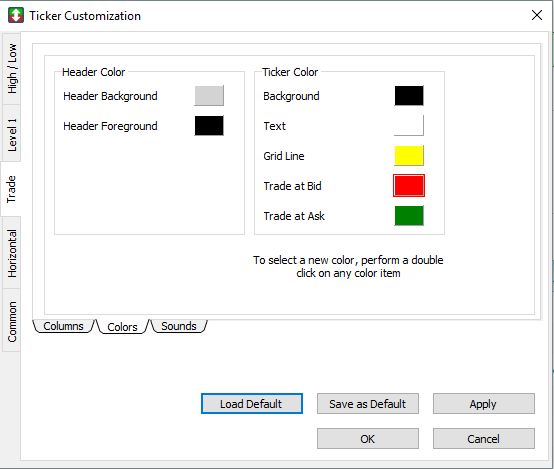
2. The Color Selector window appears. Click a color, and then click OK.
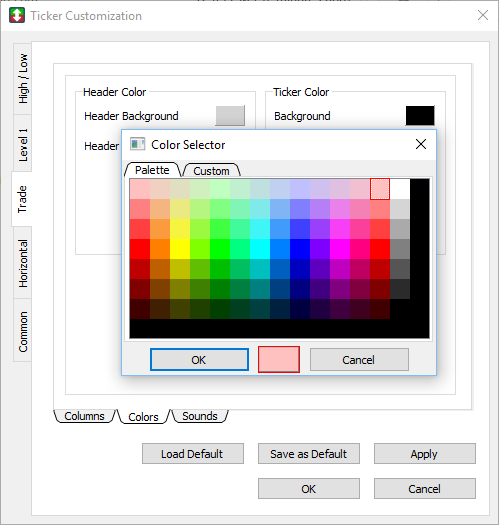
3. In the Color window, click Apply, and then click OK.
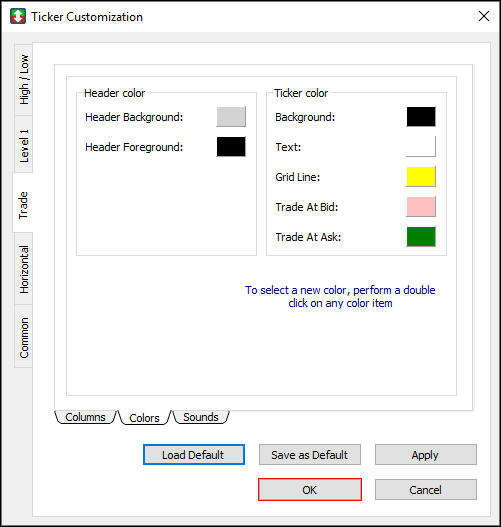
4. The color is set.
Sounds
Use the Sounds window to enable sound effects for alerts when alert conditions are met.
1. Click the Sounds sub-tab.
2. The Sounds window appears.
Set a sound effect
1. In the Sounds window, click the New button.
2. A table row appears.
3. Type a Symbol, click an Alert Type, click a Condition, and then type a Parameter value for the symbol.
4. Click the (…) button, click a WAV sound file in the media folder, and then click Open.
5. Select the check box for the symbol, and then click OK.
6. The alert sound effect is set.
7. To reset an alert, click the Reset button.
Horizontal
Use the Horizontal window to show columns, configure horizontal display options, and set a font for the Ticker window’s Horizontal mode.
- Click the Horizontal tab to open the Horizontal window.
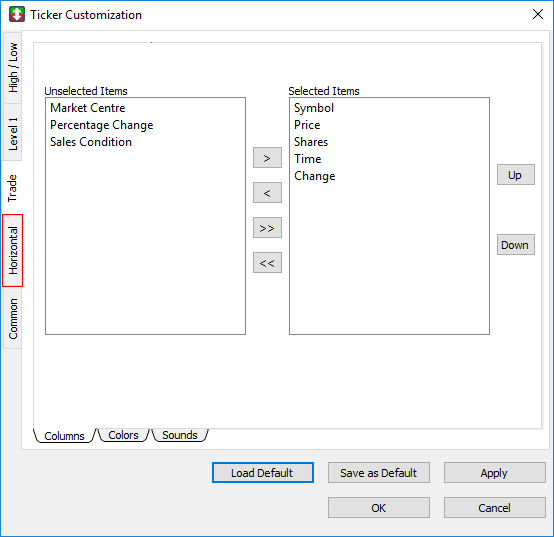
The Horizontal window contains three sub-tabs: Columns, Display Options, and Font.
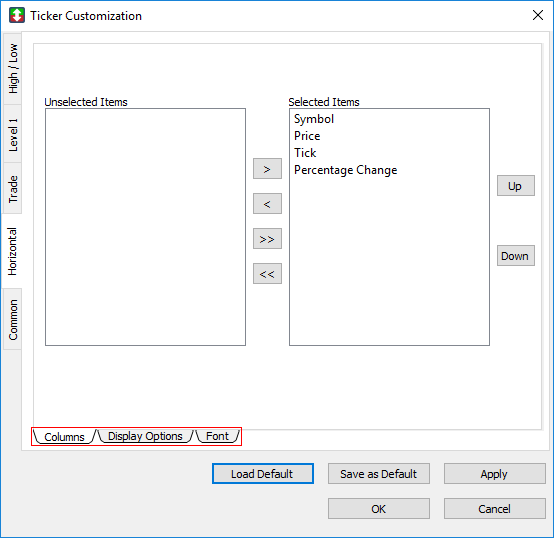
Columns
Use the Columns window to show or hide columns in Horizontal mode.
1. Click the Columns sub-tab.
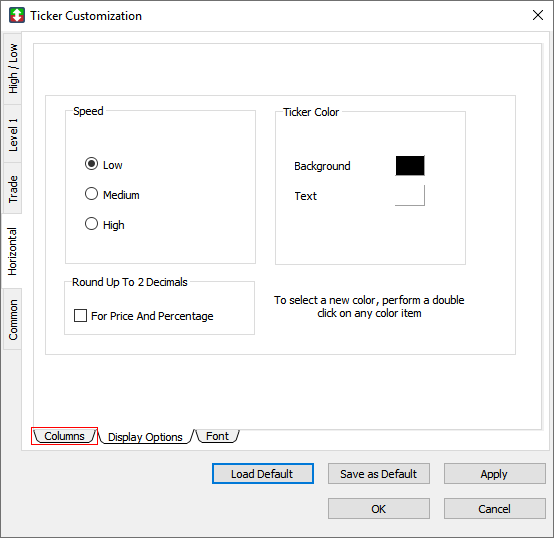
2. The Columns window appears.
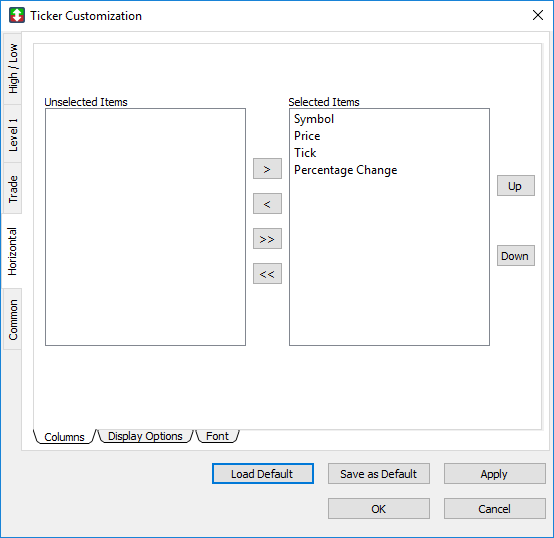
Show a column in Horizontal mode
1. Click an item in the Unselected items list.
2. Click the right arrow to move the item to the Selected items list.
3. Click OK.
4. The column appears in the Ticker window.
Hide a column from Horizontal mode
1. Click an item in the Selected items list.
2. Click the left arrow to move the item to the Unselected items list.
3. Click OK.
4. The column is hidden from the Ticker window.
Display Options
Use the Display Options window to configure display options in Horizontal mode.
1. Click the Display Options sub-tab.
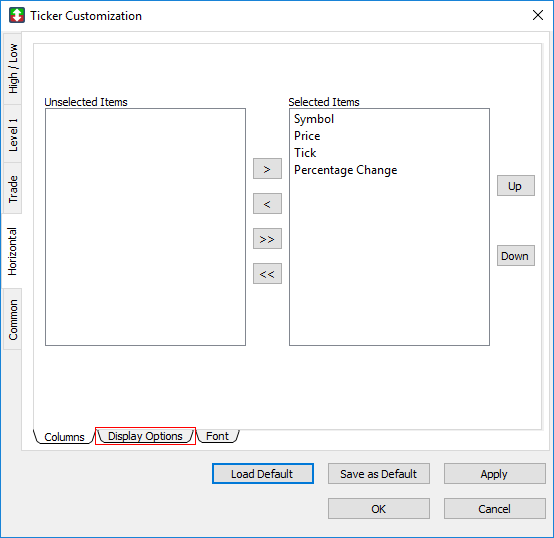
2. The Display Options window appears.
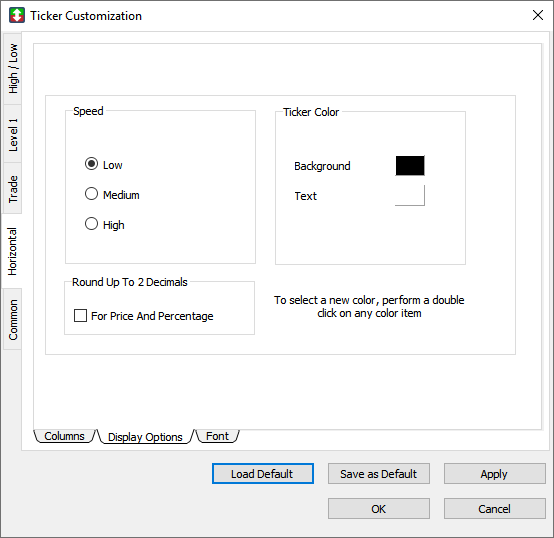
Set the ticker speed
1. In the Speed view, select the Low, Medium, or High option.
2. Click OK.
3. The ticker scrolling speed is set for Horizontal mode.
Set the ticker color
1. In the Ticker Color view, double-click the color box next to Background or Text.
2. The Color Selector window appears. Click a color, and then click OK.
3. In the Display Options window, click OK.
4. The color is set for Horizontal mode.
Round up price and percentage by 2 decimal places
1. In the Round Up To 2 Decimals view, select the For Price And Percentage check box.
2. Click OK.
3. Price and percentage values appearing in Horizontal Mode will display as rounded to 2 decimal places.
Font
Use the Font window to set the font in Horizontal mode.
1. Click the Font sub-tab.
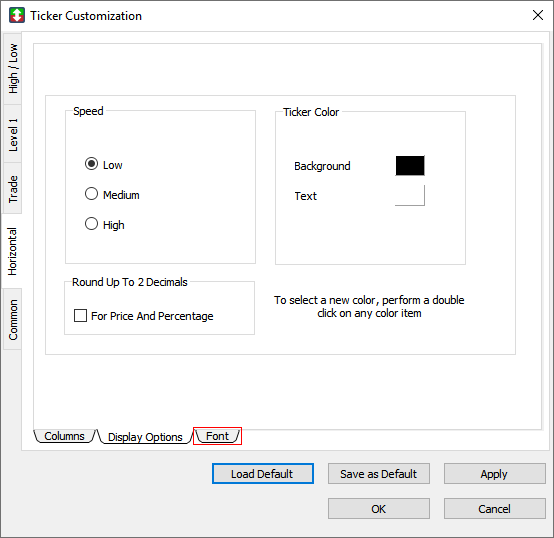
2. The Font window appears.
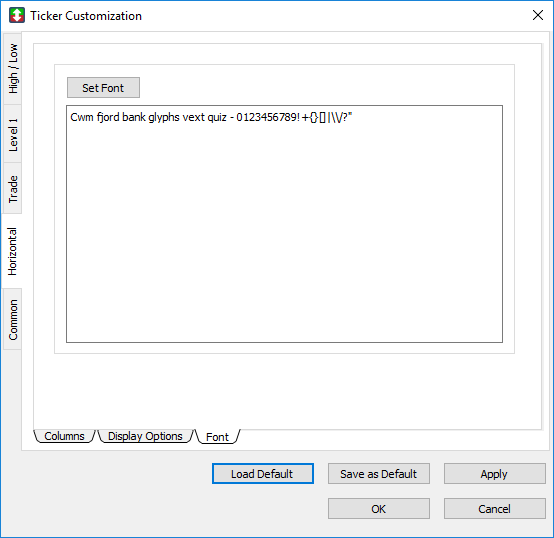
Set a font for the Ticker Window
1. Click Set Font.
2. The Select Font window appears.
3. Click the font, font style, size, effects, and writing system you want to set.
4. Click OK.
5. In the Font window, click OK.
6. The font is set for Horizontal mode.
Common
Use the Common window to set the common settings for the Ticker window.
- Click the Common tab to open the Common window.
The Common window contains four sub-tabs: Lines/Bars, Font, Symbol Lists, and Group Link.
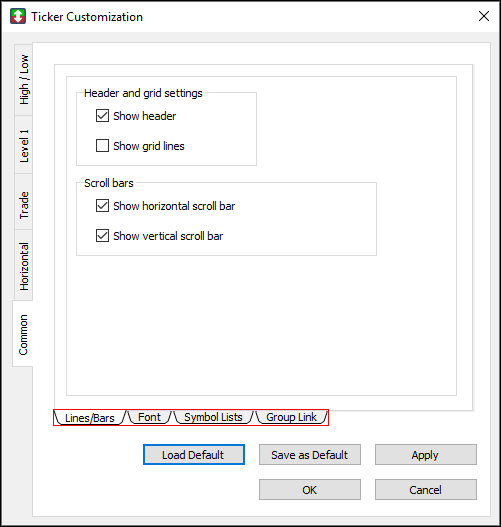
Lines/Bars
Use the Lines/Bars window to show lines and bars in the Ticker window.
1. Click the Lines/Bars sub-tab.
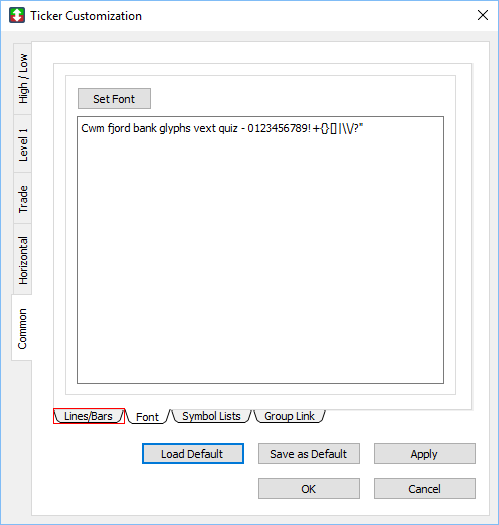
2. The Lines/Bars window appears.
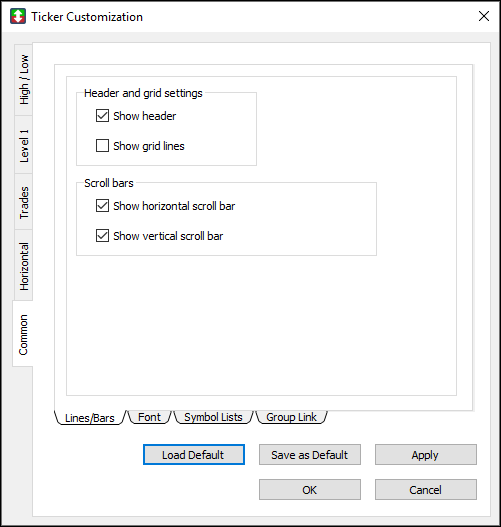
Show lines and bars
- Select or clear the check boxes next to the features to show or hide them from the ticker window.
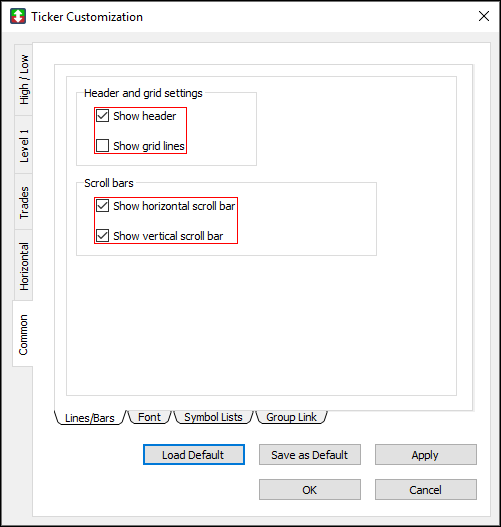
Font
Use the Font window to set the overall font for the Ticker window.
1. Click the Font sub-tab.
2. The Font window appears.
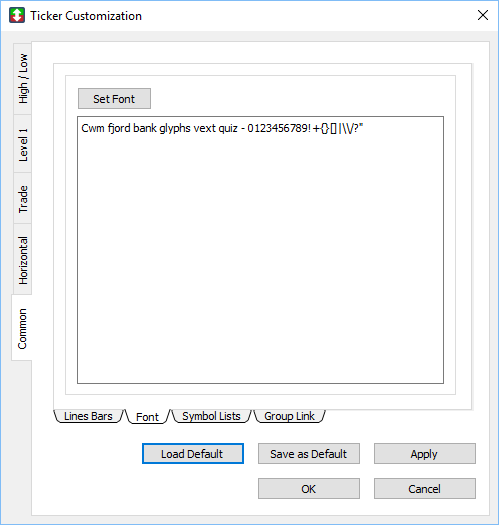
Set a font for the Ticker Window
1. Click Set Font.
2. The Select Font window appears.
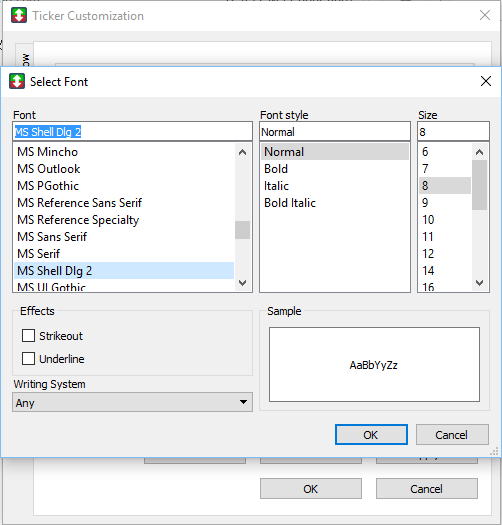
3. Click the font, font style, size, effects, and writing system you want to set.
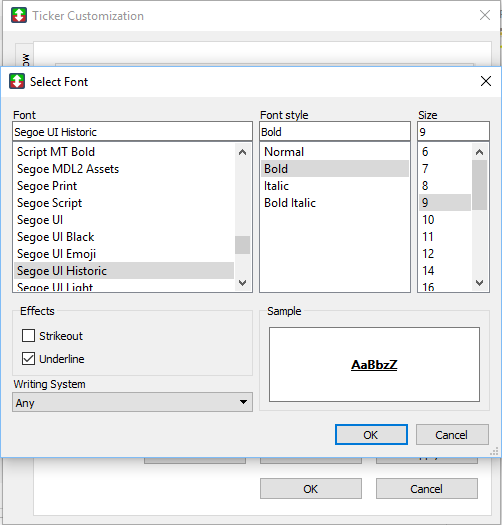
4. Click OK.
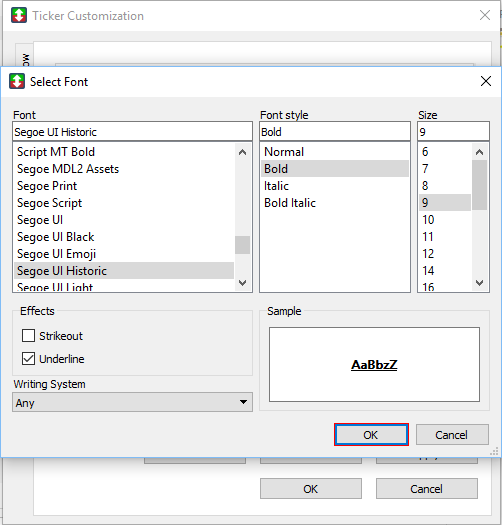
5. Next, click OK.
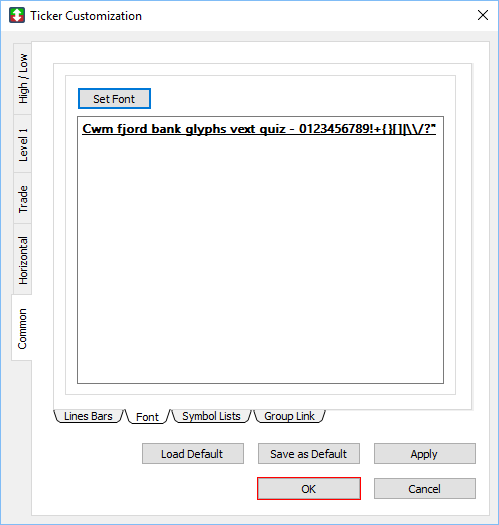
6. The new font appears in the Ticker window.
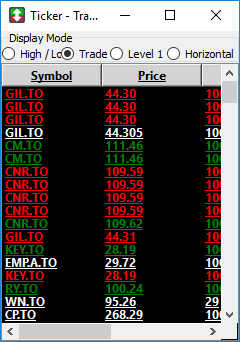
Symbol Lists
Use the Symbol Lists window to show specific symbols.
1. Click the Symbol Lists sub-tab.
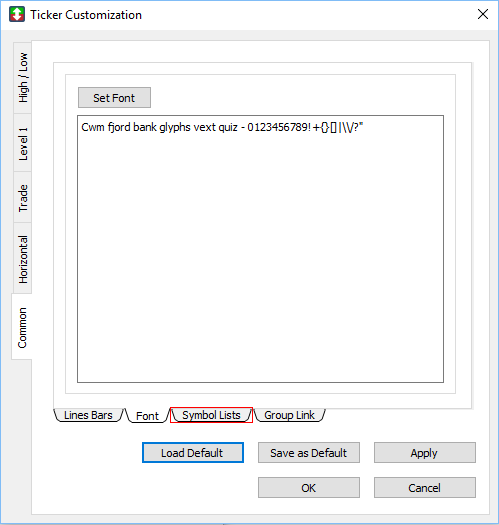
2. The Symbol Lists window appears.
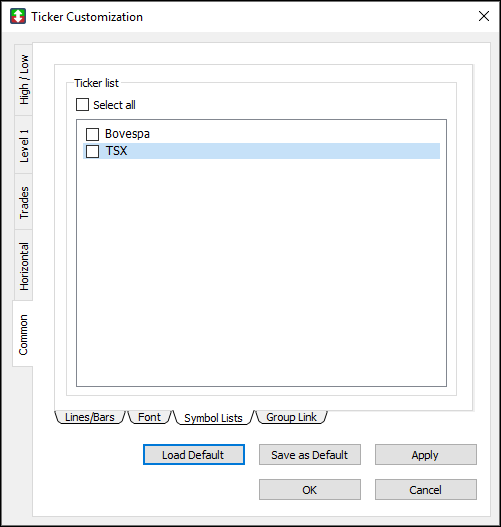
Show a symbol list
- Select or clear the check box next to the symbol list name to show or hide it from the Ticker window.
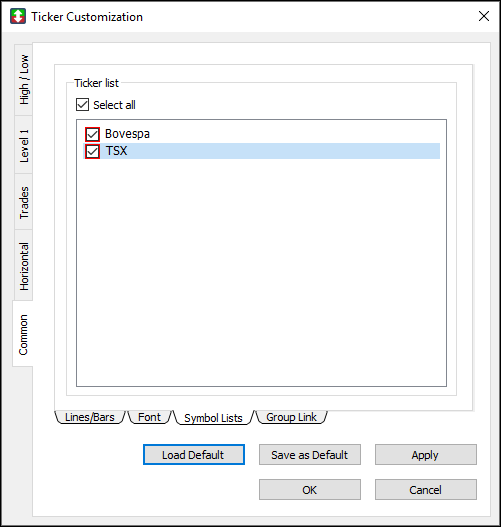
Note: to view values for symbols in the Ticker window, first set up a symbol list in the Symbols List Editor.
Group Link
Use the Group Link option to link the Ticker window to other tools.
1. Click the Group Link sub-tab in the Common window.
2. The Group Link window appears.
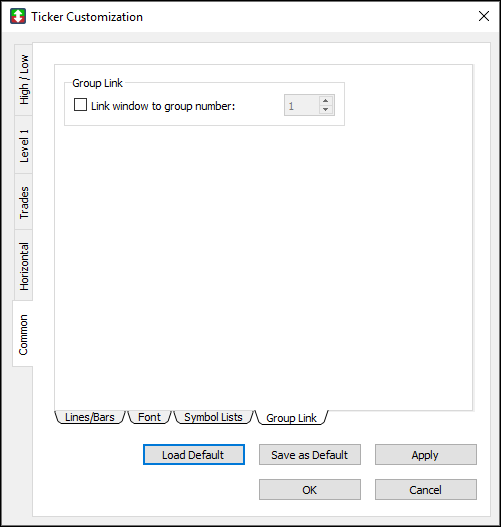
Link the Ticker window to other windows
1. Select the Link window to group number check box.
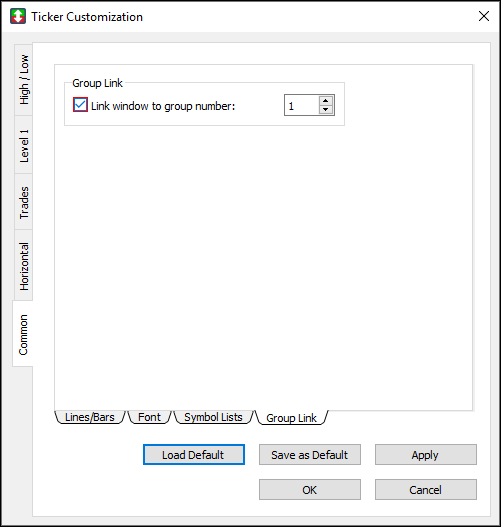
2. Type the number of the window you would like to link the Ticker window to.
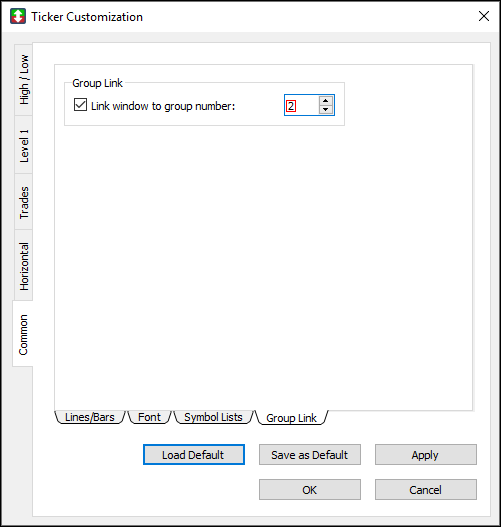
3. Click OK.
4. After the link is applied, a symbol change in the Ticker window causes a change in the symbol and data of the linked window.
Alignment Editor
Use the Alignment Editor to align columns to the left, center, or right for the Ticker window.
Align a column in the Ticker window
1. Right-click a column heading, such as Symbol, Price, or Bid, in the Ticker window.
2. The Alignment Editor appears.
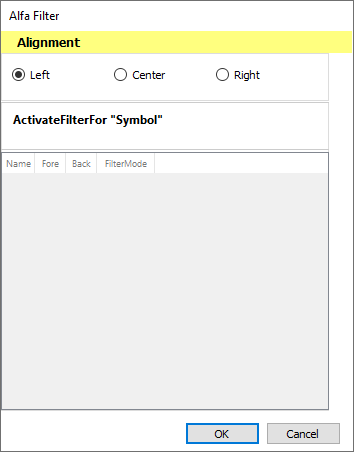
3. In the Alignment section, click Left, Center, or Right to align the column left, center, or right.
4. The column is aligned.
>Back to Top
PPro8 Time of Sales
The PPro8 Time of Sales (TOS) window displays an instrument's executions.
Open a new Time of Sales window
1. On the PPro8 toolbar, click TimeOfSale.

2. A Time of Sales window appears.
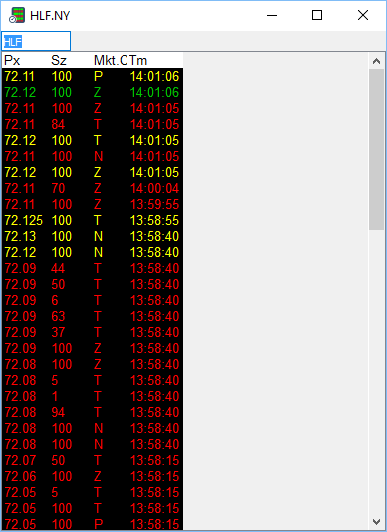
View TOS data in the Time of Sales window
1. Type the symbol in the field at the top left of the Time of Sales window (for example, BB).
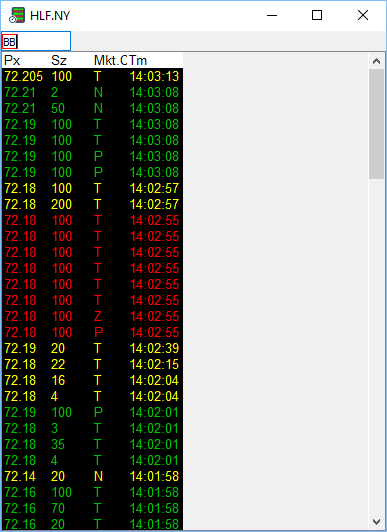
2. Press Tab.
3. Type or click the symbol’s market extension (for example, TO).
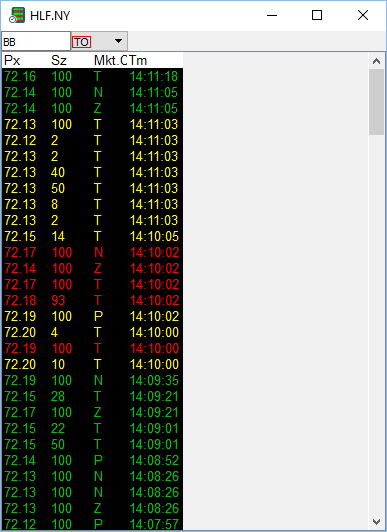
4. Press Enter.
5. The Time of Sales window populates with data about the symbol.
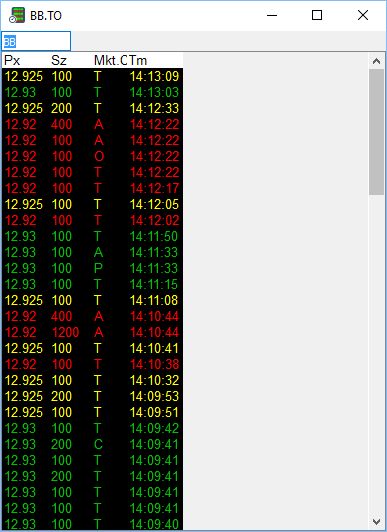
The TOS window displays data in the following fields by default:
- Px (Price): the price at which the trade occurred (denominated in local currency).
- Sz (Size): the number of shares or contracts traded.
- Mkt. Ctr. (Market Center): the exchange or ATS where the trade was executed.
- Tm (Time): the time when the trade occurred.
If added in Customization, the TOS window also displays data in the following fields:
- Tk (Tick): the price up/down/neutral:
- U = Uptick
- D = Downtick
- N = Neutral
- SbMkt (Submarket ID): the ID of the submarket, if any.
- Sl.Cond. (Sale Condition): the condition of the sale.
Time of Sales Window Customization
To make changes to the Time of Sales window settings, right-click in the Time of Sales window to open the Time of Sale Customization Window. This window displays two main tabs on the left: Display and Settings.
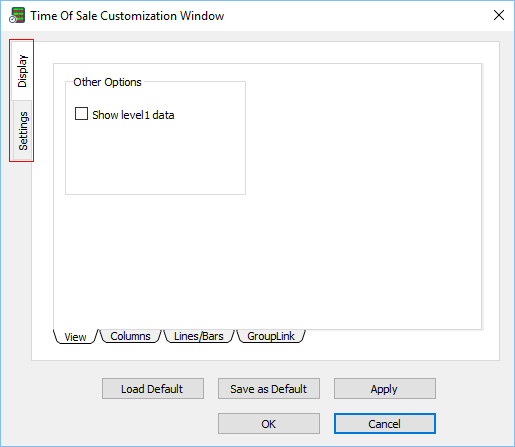
Display
Use the Display window to set the display settings for the Time of Sales window.
- Click the Display tab to open the Display window.
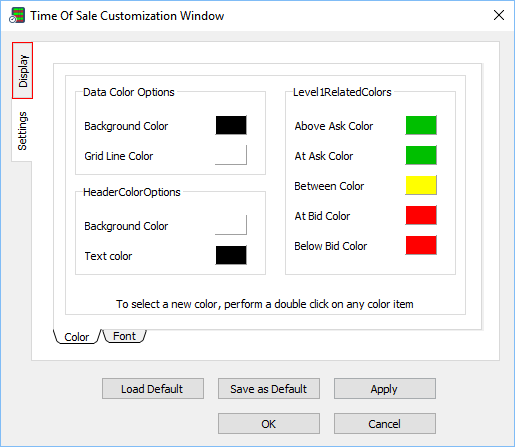
The Display window contains four sub-tabs: View, Columns, Lines/Bars, and Group Link.
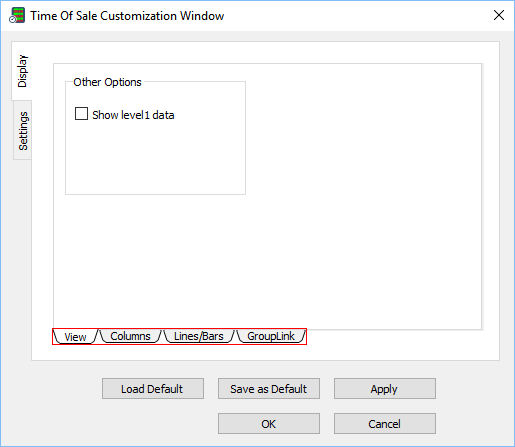
View
Use the View window to set Other Options.
- Select the Show level1 data check box to show Level 1 (Lv1) quotes in the Time of Sales window.
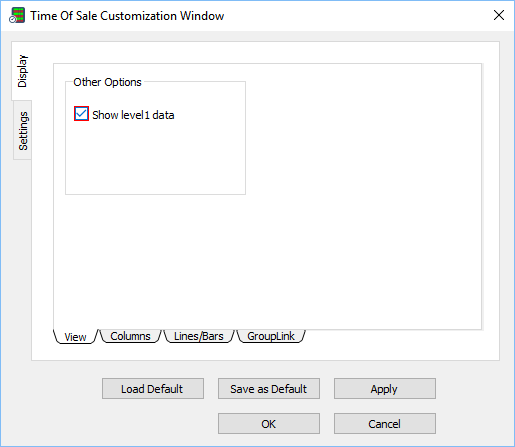
Columns
Use the Columns window to show or hide columns.
1. Click the Columns sub-tab in the Display Window.
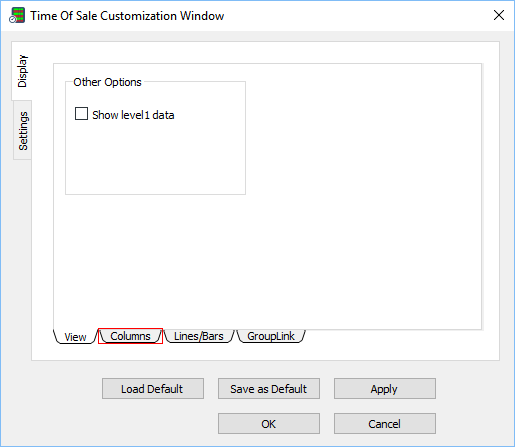
2. The Columns window appears.
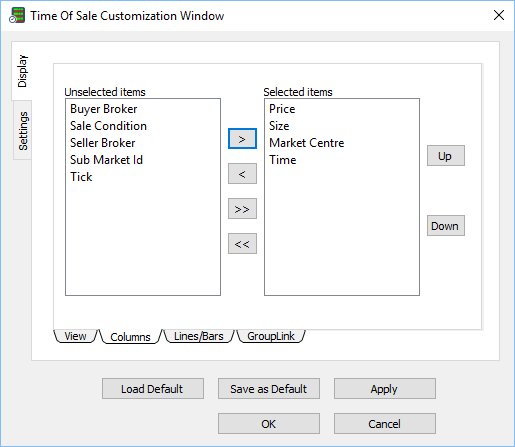
Show a column in the Time of Sales window
1. In the Columns window, click an item in the Unselected items list.
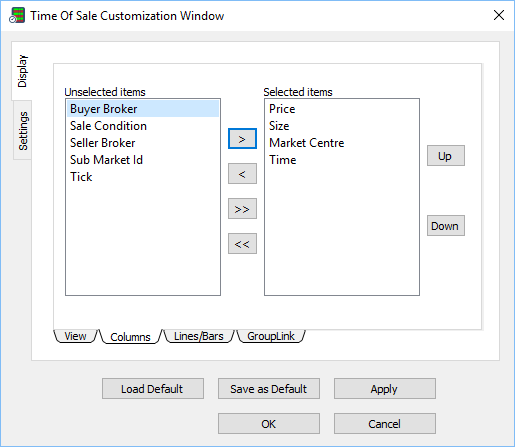
2. Click the right arrow ( > ) to move the item to the Selected items list.
3. Click OK.
4. The item appears in the Time of Sales Window.
Hide an item from the Time of Sales Window
1. In the Columns window, click an item in the Selected items list.
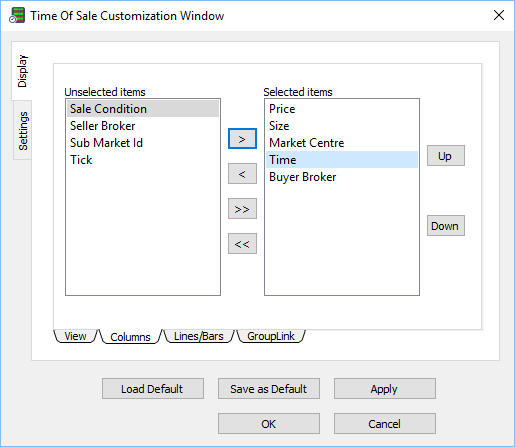
2. Click the left arrow ( < ) to move the item to the Unselected items list.
3. Click OK.
4. The item is hidden from the Time of Sales window.
Lines/Bars
Use the Lines/Bars window to show or hide the header, grid lines, scroll bars, and time (to the second).
1. Click the Lines/Bars sub-tab in the Display window.
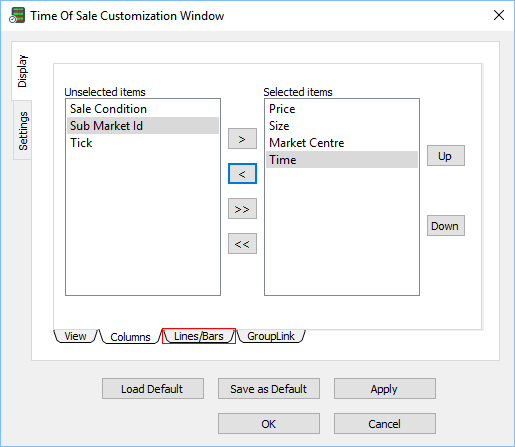
2. The Lines/Bars window appears.
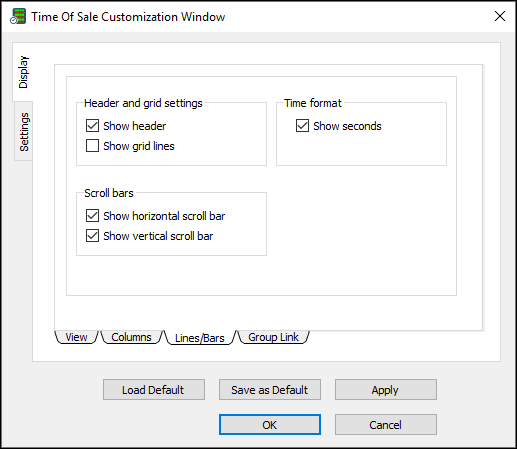
Select or clear the check boxes under the Header and Grid Settings, Time format, and Scroll Bars headings to show or hide the various features.
Group Link
Use the Group Link window to link the Time of Sales window to other tools, such as the Stock Window and the Chart Window.
1. Click the Group Link sub-tab in the Display window.
2. The Group Link window appears.
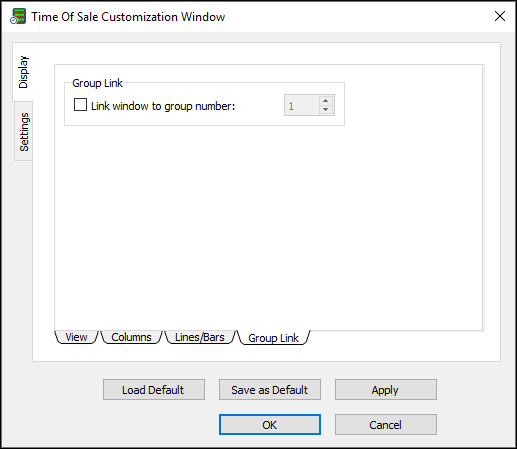
Link the Time of Sales window to other windows
1. Select the Link window to group number check box.
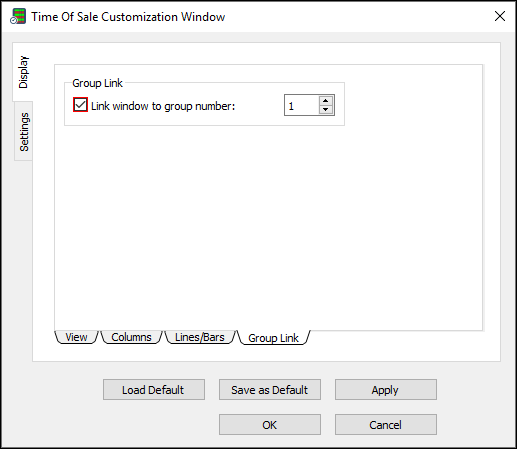
2. Type the number of the window you would like to link the Time of Sales window to.
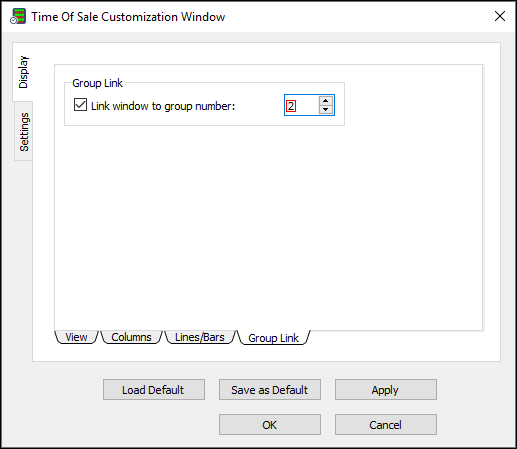
3. Click OK.
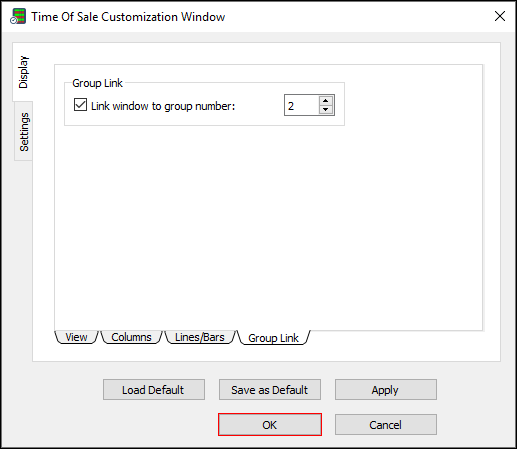
4. After the link is applied, a symbol change in the Time of Sales window causes a change in the symbol and data of the linked window.
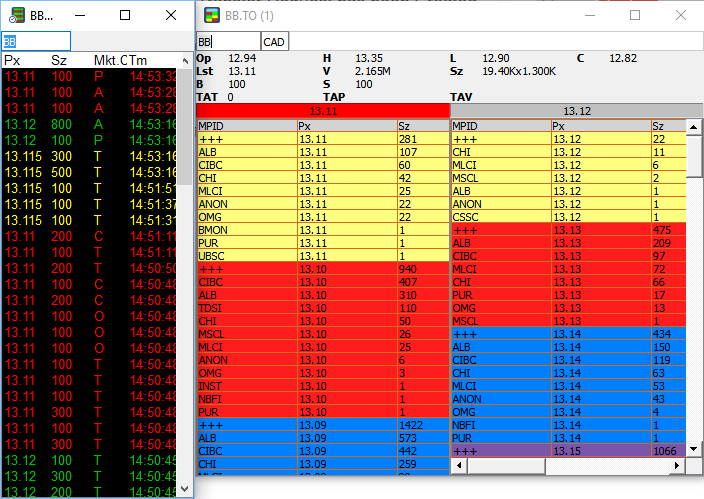
Settings
Use the Settings window to customize how data is displayed in the Time of Sales window.
- Click the Settings tab to open the Settings window.
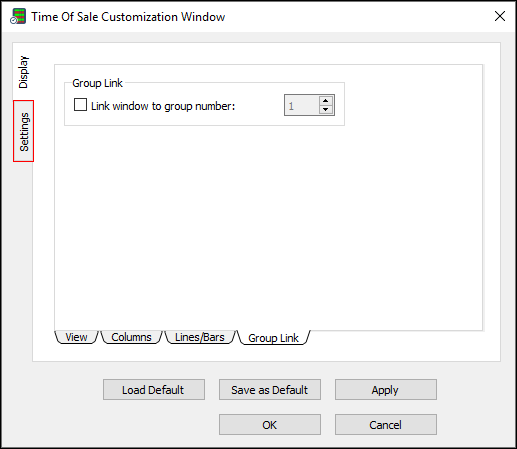
The Settings window contains two sub-tabs: Color and Font.
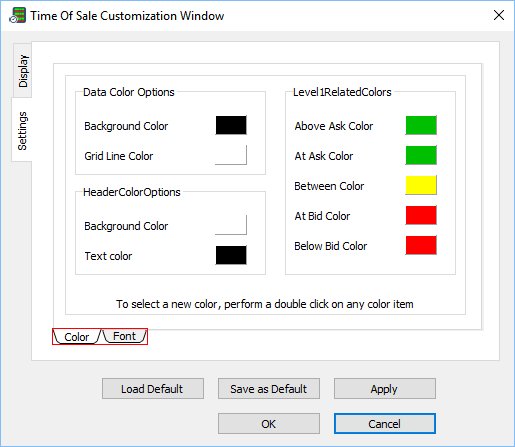
Color
Use the Color window to set the colors for data, Level 1, and the header.
1. Click the Color sub-tab.
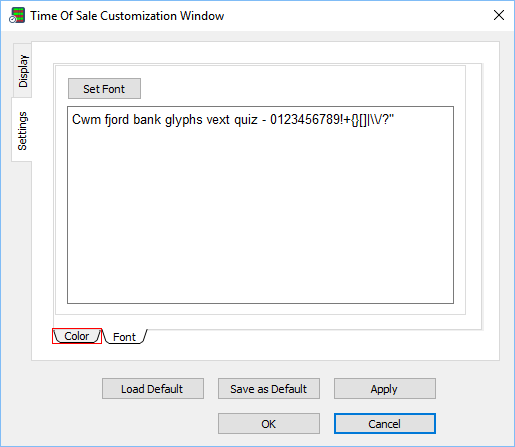
2. The Color window appears.
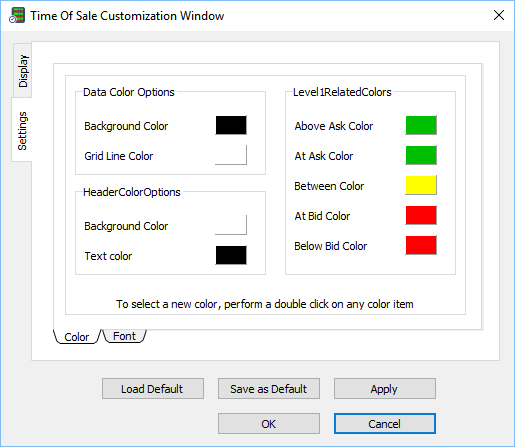
Set a color
1. Double-click the color box next to a feature, for example, Background color under the Data color options heading.
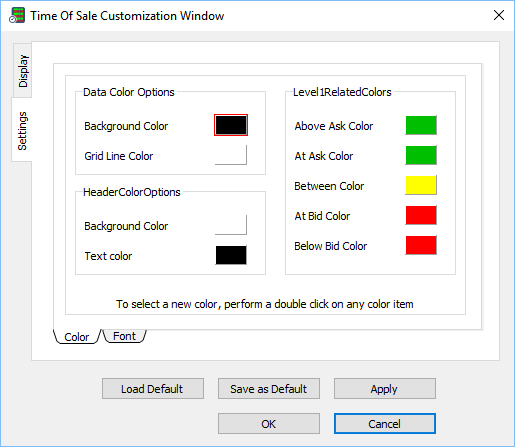
2. The Color dialog window appears. Click a color, and then click OK.
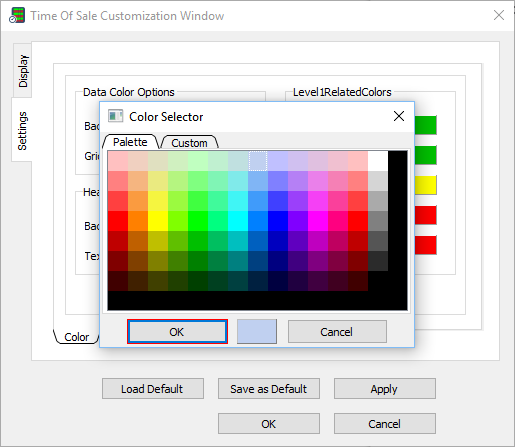
3. In the Color window, click OK.
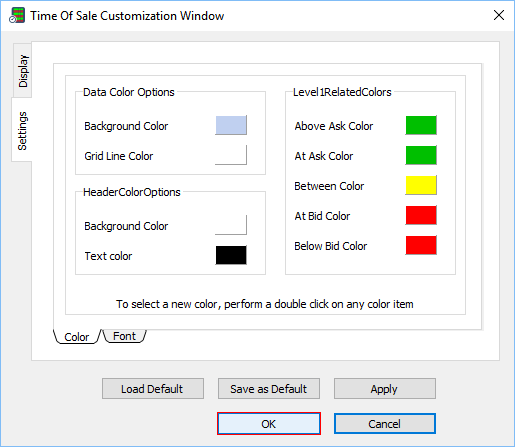
4. The color is set.
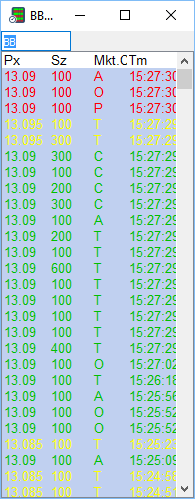
Font
Use the Font window to set the overall font for the Stock Window.
Set a font for the Time of Sales window
1. In the Settings window, click the Font sub-tab.
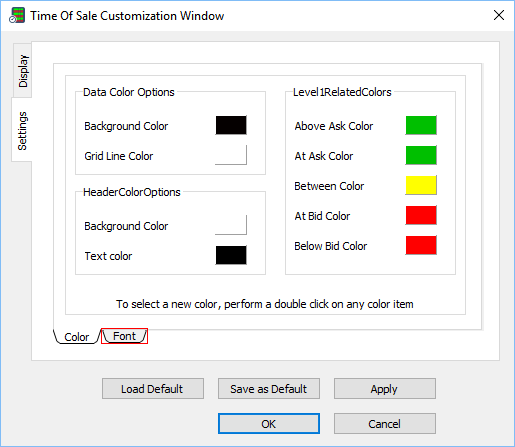
2. The Font window appears.
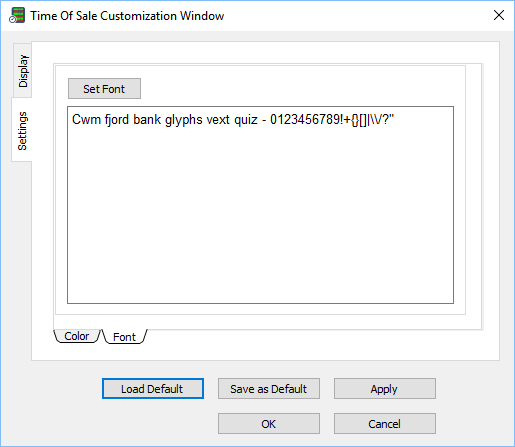
3. Click Set Font….
4. The Select Font window appears.
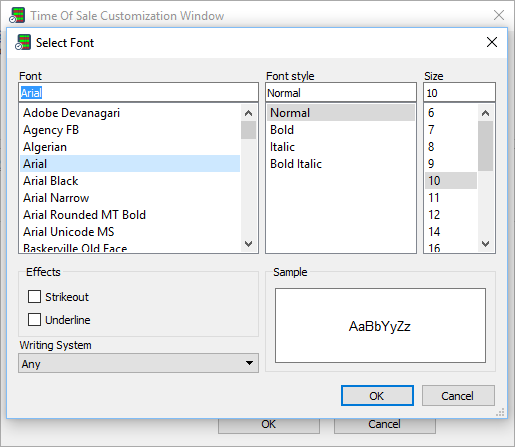
5. Click the font, font style, size, effects, and writing system you want to set. Click OK.
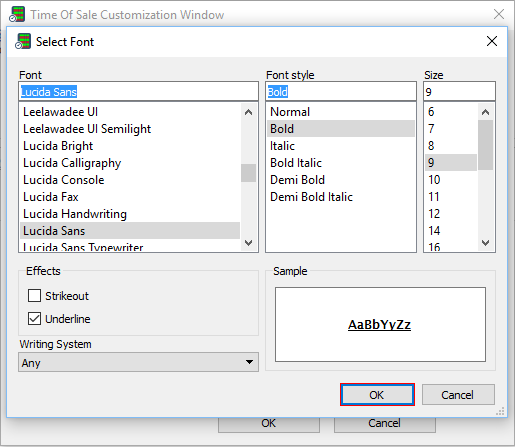
6. In the Font window, click OK.
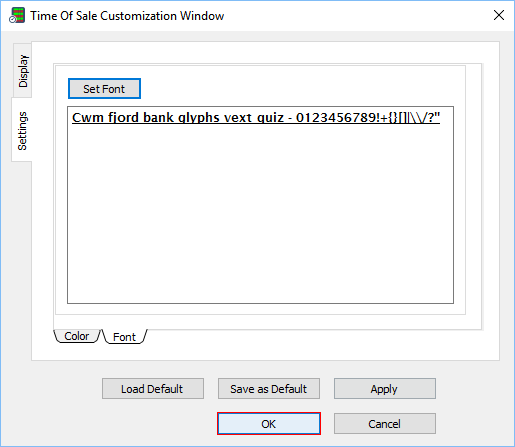
7. The new font appears in the Time of Sales window.
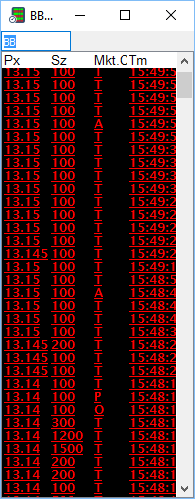
Alignment Editor and Filter Option
Use the Alignment Editor and Filter Option to align columns to the left, center, or right, and to set a filter for the Time of Sales window.
Align a column and activate a filter in the Time of Sales window
1. Right-click a column heading, such as Price, Size, or Mkt. Ctr., in the Time of Sales window.
2. The Alignment Editor and Filter Option appear.
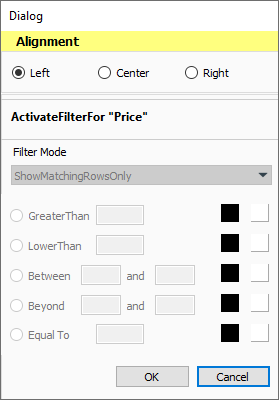
3. In the Alignment section, click Left, Center, or Right to align the column left, center, or right.
4. Click Activate filter for Price to set the filter option.
5. Click a filter parameter option, type a value or values, and double-click the color boxes to set colors for the filter.
6. Click OK.
7. The column is aligned and the filter is activated for the column.
>Back to Top
PPro8 Trader Monitor
With the PPro8 Trader Monitor, you can monitor the trading activities of your traders for each currency. Your traders can also track their own trades using this tool.
Open Trader Monitor
1. On the PPro8 toolbar, click TraderMonitor.

2. The Trader Monitor window appears.
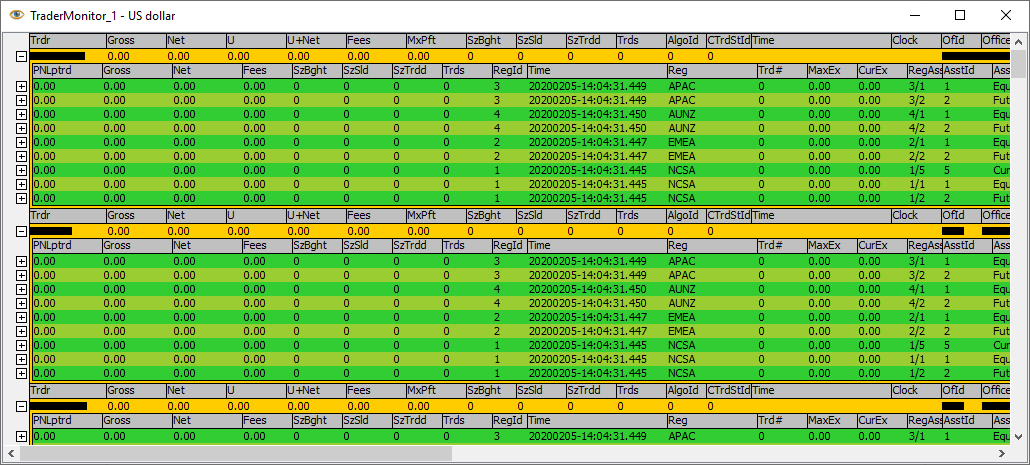
Trader Monitor components
The Trader Monitor window is divided into sections by trader, and shows the following information for each trader:
- Trdr: the Trader ID
- Gross: the gross amount
- Net: the net amount
- U: the unrealized amount
- U + Net: the unrealized amount plus the Net amount
- Fees: the sum of the fees
- MxPft: the maximum profit
- LFT: the Loss From Top
- ALFT: the allowed Loss From Top
- ANetL: the allowed Net Loss
- PastNL: the amount past allowed Net Loss
- %NL: the percentage Net Loss
- %UL: the percentage unrealized amount
- SzBght: the size bought
- SzSld: the size sold
- SzTrdd: the size of the trades
- Trds: the number of trades
- AlgoId: the algorithm ID
- CTrdStId: the current trader state ID
- Time: the current time
- Clock: the countdown clock
- OfId: the office code
- Office: the office name
- Algo: the algorithm
- CTrdSt: the current trader state
- ULFT: the unrealized Loss From Top
- SymTrdd: the symbols traded
- LgnSt: the login state
- MktRjct#: the number of market rejects
- Ordr #: the number of orders
- Cncl #: the number of cancels and part-cancels
- OpcRjct #: the number of OPC rejects
- OrdrToFill: the order-to-fill
- OrdrToCncl: the order-to-cancel
- MaxSz: the maximum order size
- AveSz: the average order size
- DurFills: the average duration of fills and part-fills
- DurCncls: the average duration of cancels
- AcctId: the account ID
- Gross: the gross amount
- Net: the net amount
- U: the unrealized amount
- ActFee: the activity fees
- ClrFee: the clearing fee
- ExecFee: the execution fee
- GwFee: the gateway fee
- RegFees: the regulatory fees
- Fees: the total of all fees
- BP: the available buying power
- RBP: the remaining buying power
- ExpLng: the exposure for a long position
- ExpShrt: the exposure for a short position
- Exp: the current exposure
- ALFT: the allowed Loss From Top
- LFT: the Loss From Top
- LFTR: the Loss From Top ratio
- SzLng: the shares long
- SzShrt: the shares short
- SzIn: the shares in
- SzTrdd: the size traded
- Trds: the total number of trades
- OpCnt: the open position count
- OpTrd: the open position trades
Trader Monitor Customization
To make changes to the Trader Monitor settings, right-click anywhere in the Trader Monitor to open the Trader Monitor Customization. This window displays three main tabs on the left: Columns, Fonts, and Colors.
- Click the Layer menu, and then click Trader or Account to load the settings for either layer type in each window.
Columns
Use the Columns window to manage columns that appear in the Trader Monitor.
- Click the Columns tab to open the Columns window.
Show a column in the Trader Monitor
1. In the Columns window, click an item in the Unselected items list.
2. Click the right arrow to move the item to the Selected items list.
3. Click OK.
4. The column appears in the Trader Monitor window.
Hide a column in the Trader Monitor
1. In the Columns window, click an item in the Selected items list.
2. Click the left arrow to move the item to the Unselected items list.
3. Click OK.
4. The column is hidden from the Trader Monitor window.
Fonts
Use the Fonts window to to set the overall font for the Trader Monitor.
1. In the Customization window, click the Fonts sub-tab.
2. The Font window appears.
3. Click Set Font.
4. The Select Font window appears.
5. Click the font, font style, size, effects, and writing system you want to set.
6. Click OK.
7. In the Customization window, click OK.
8. The font for the Trader Monitor is set.
Colors
Use the Colors window to set the colors for Trader Monitor elements.
- Click the Colors tab to open the Colors window.
Set a color
1. In the Colors window, double-click a color box, for example, Fore (foreground color) for Main colors.
2. The Sage color dialog window appears.
3. Click a color, and then click OK.
4. In the Customization window, click OK.
5. The color is set.
Export Trader Monitor data
1. Right-click anywhere in the Trader Monitor, and then click Export Table to export the table to Excel.
2. Right-click a cell or row, and then click Copy Cell to Clipboard, or Copy Row to Clipboard, or Copy Key to Clipboard to save to clipboard.
>Back to Top


